Full image of globe every 10 minutes (142 per day)
*20 lines of scanning (stitch lines) - 21% savings
11,000 x 11,000 state of the art in weather observation -Oblateness of globe (1/2 kilometer to 2 kilometers. )_
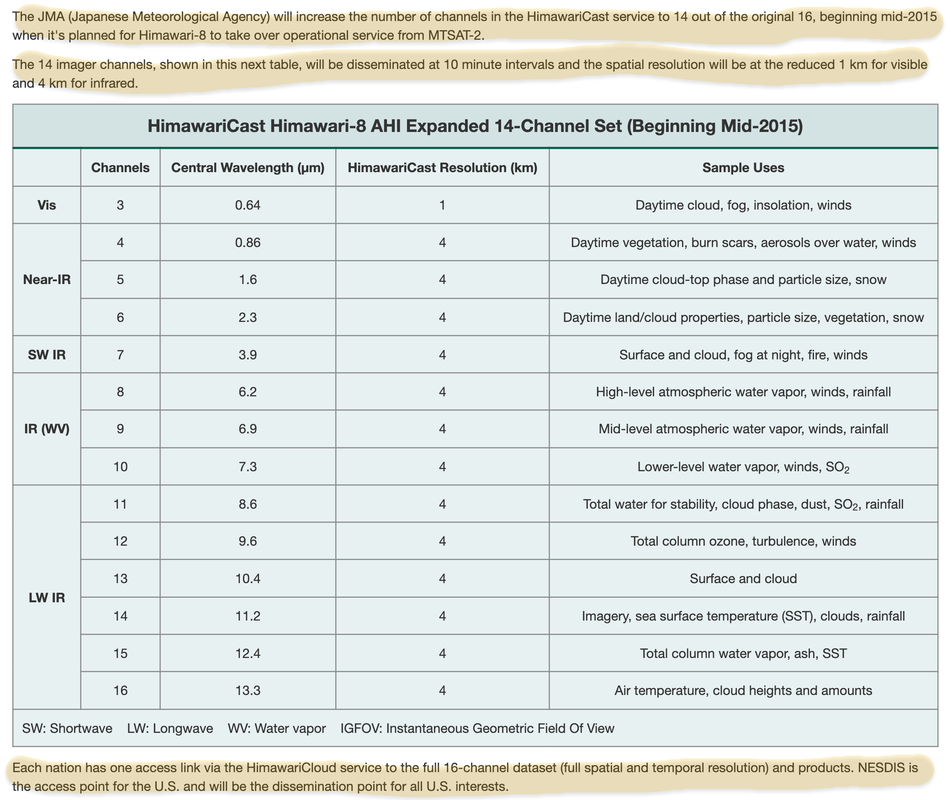
*Advanced Himawari Imager (AHI) is a Multispectral Camera with sixteen channels (0.46 µm to 13.3 µm)
-The spectrum is recorded with 3 overlapping independent delivers gray scale image data: red, green and blue channels. If these channels are superimposed, a so-called true color image is recreated.
*true-color imagery tool visualizing:bushfires, dust storms, volcanic eruptions, and even solar eclipses
*The camera provides cloud, temperature, wind, precipitation, and aerosol distribution data over the various spectral ranges.
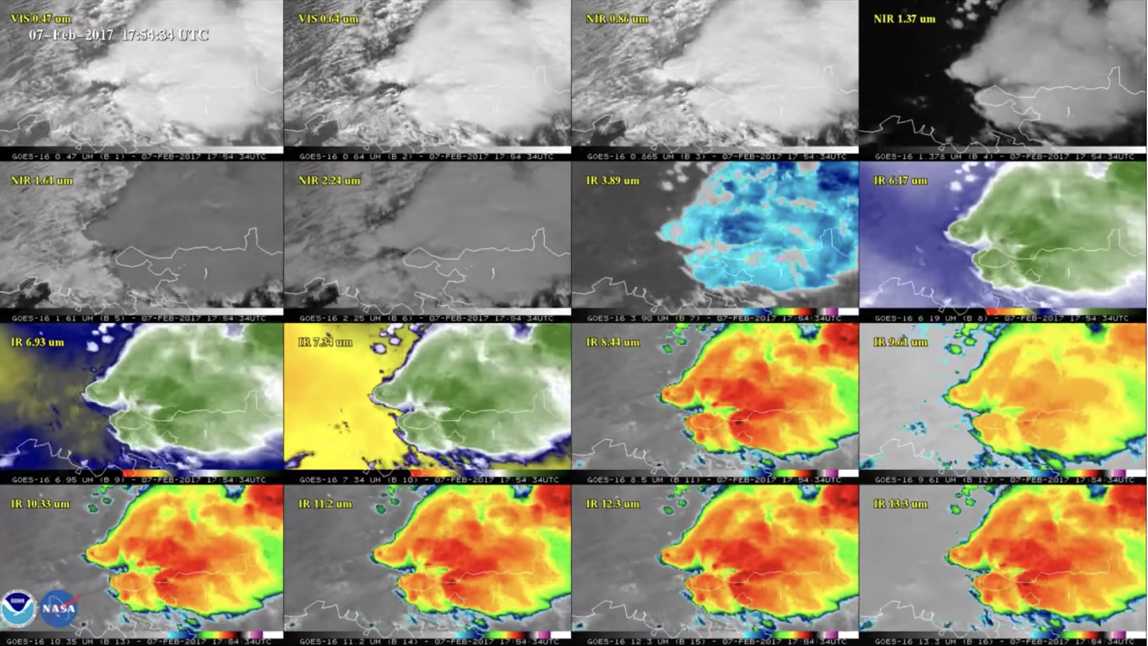
It is not simply a photo. It is several photos in different wavelengths calibrated to detect different things. The objective of the Himawari mission is not to prove that the earth is round, but to detect weather phenomena, smoke.
Because while we can appreciate this pictures for their beauty these are actually meteorological satellites!
The data that comes down is important for predicting weather and other things.
*20 lines of scanning (stitch lines) - 21% savings
11,000 x 11,000 state of the art in weather observation -Oblateness of globe (1/2 kilometer to 2 kilometers. )_
*Advanced Himawari Imager (AHI) is a Multispectral Camera with sixteen channels (0.46 µm to 13.3 µm)
-The spectrum is recorded with 3 overlapping independent delivers gray scale image data: red, green and blue channels. If these channels are superimposed, a so-called true color image is recreated.
*true-color imagery tool visualizing:bushfires, dust storms, volcanic eruptions, and even solar eclipses
*The camera provides cloud, temperature, wind, precipitation, and aerosol distribution data over the various spectral ranges.
It is not simply a photo. It is several photos in different wavelengths calibrated to detect different things. The objective of the Himawari mission is not to prove that the earth is round, but to detect weather phenomena, smoke.
Because while we can appreciate this pictures for their beauty these are actually meteorological satellites!
The data that comes down is important for predicting weather and other things.
Busting Globebusters Himwari Round 2!
https://www.noaa.gov/jetstream/goes_east
https://www.noaa.gov/jetstream/goes_east
A lot of this was revolving around me saying
What Paul Says [exact]:
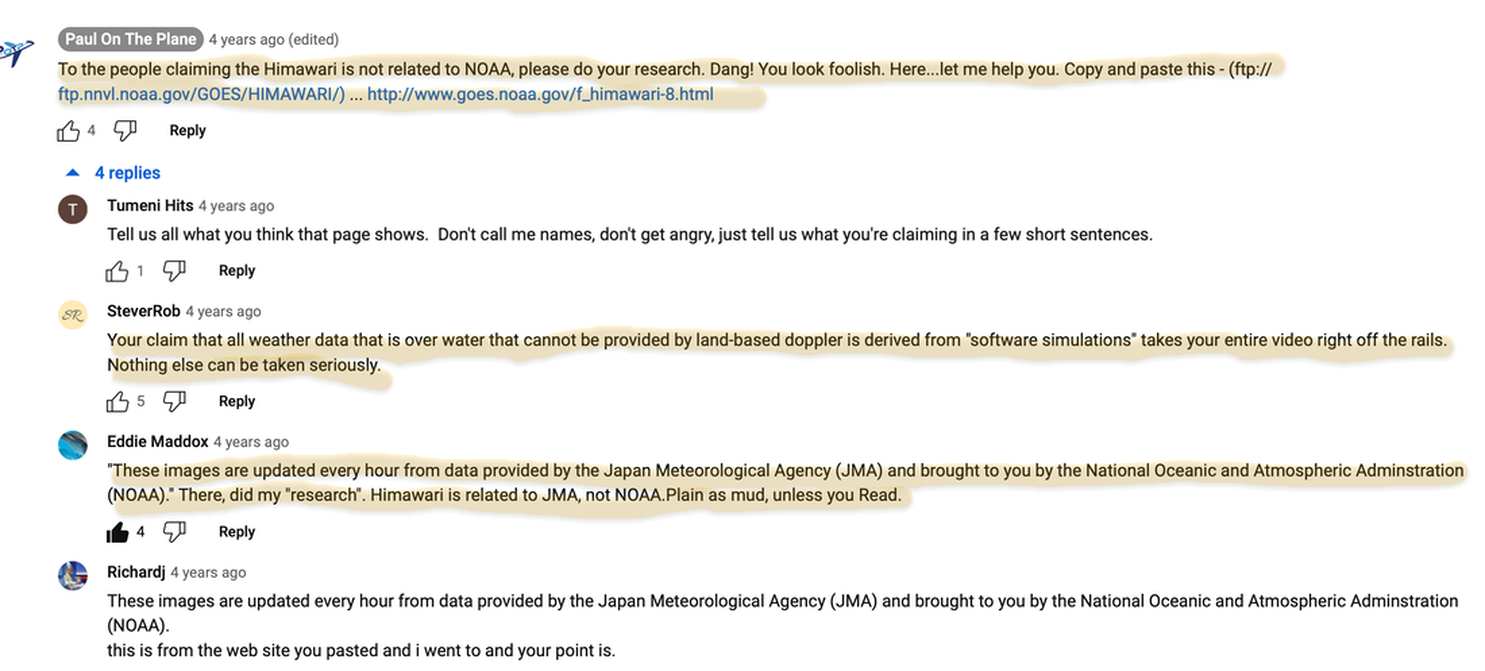
Himawari is operated by the Japanese meterological space agency and brought to us by the NOAA (National Oceanic and Atmospheric Administration
What the server actually says [exact]
These images are updated every hour from data provided by the Japan Meteorlogical Agency and brought to you by the NOAA
What Paul Says [exact]:
Himawari is operated by the Japanese meterological space agency and brought to us by the NOAA (National Oceanic and Atmospheric Administration
What the server actually says [exact]
These images are updated every hour from data provided by the Japan Meteorlogical Agency and brought to you by the NOAA
Himawari 8
Himawari 8 takes pictures of the whole earth every 10 minutes
Digital Typhoon: 'Himawari' Visible Color (Full Disk) / 2020-03-02T23:50:00Z (nii.ac.jp)
Himawari 8 takes pictures of the whole earth every 10 minutes
Digital Typhoon: 'Himawari' Visible Color (Full Disk) / 2020-03-02T23:50:00Z (nii.ac.jp)

|
|

|
|
They Thought I was confirming PoTP by showing that simulations were used... They were not listening!
Simulation of Cloud Cover ... Accurately
I did not say there is no way they can do simulations, I said they cannot simulate accurate cloud cover. Accurate and detailed cloud cover.
Simulation of Cloud Cover ... Accurately
I did not say there is no way they can do simulations, I said they cannot simulate accurate cloud cover. Accurate and detailed cloud cover.
|
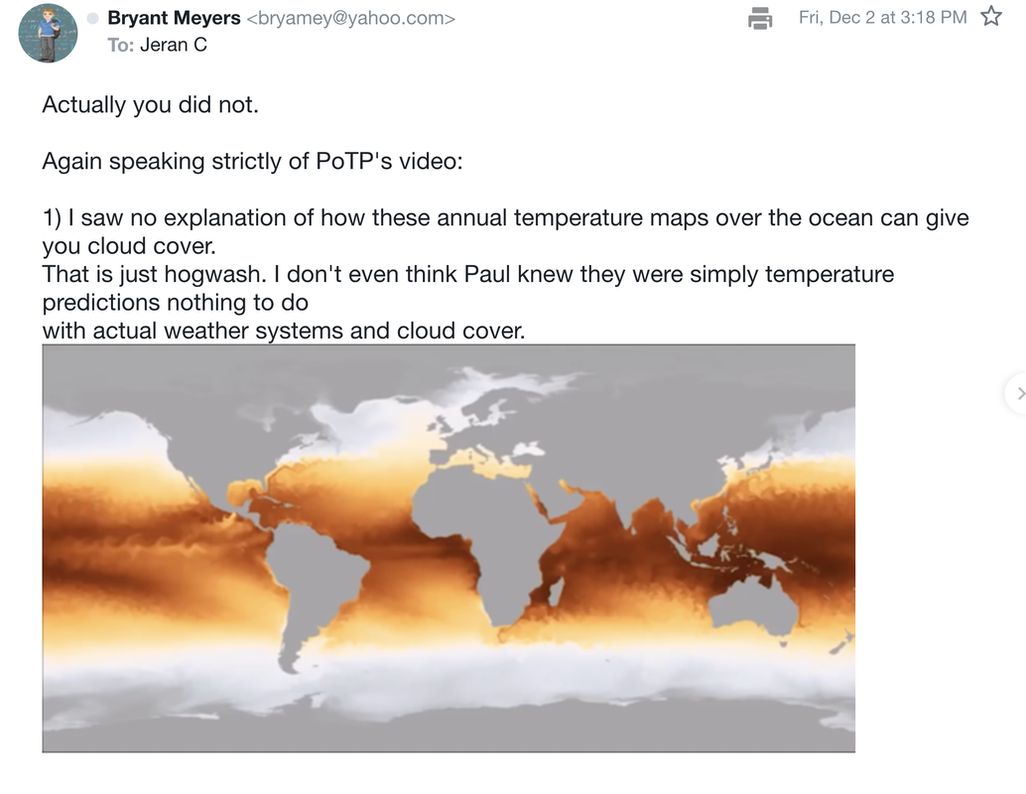
That the cloud images are generated by computer models from weather radar data, as claimed by Paul, is a lie. They are real time infrared photos from the GOES satellites. What Paul references as computer simulations of the future are global temperature predictions. They are not weather predictions. Weather can only be predicted some days in advance using current data from satellites like GOES etc. Cloud formations can not be predicted at all. Clouds are always photos.
Dave seems to think that annual globe temperature simulations somehow translate to daily cloud cover simulations through some means which he does not expand upon. ---- |
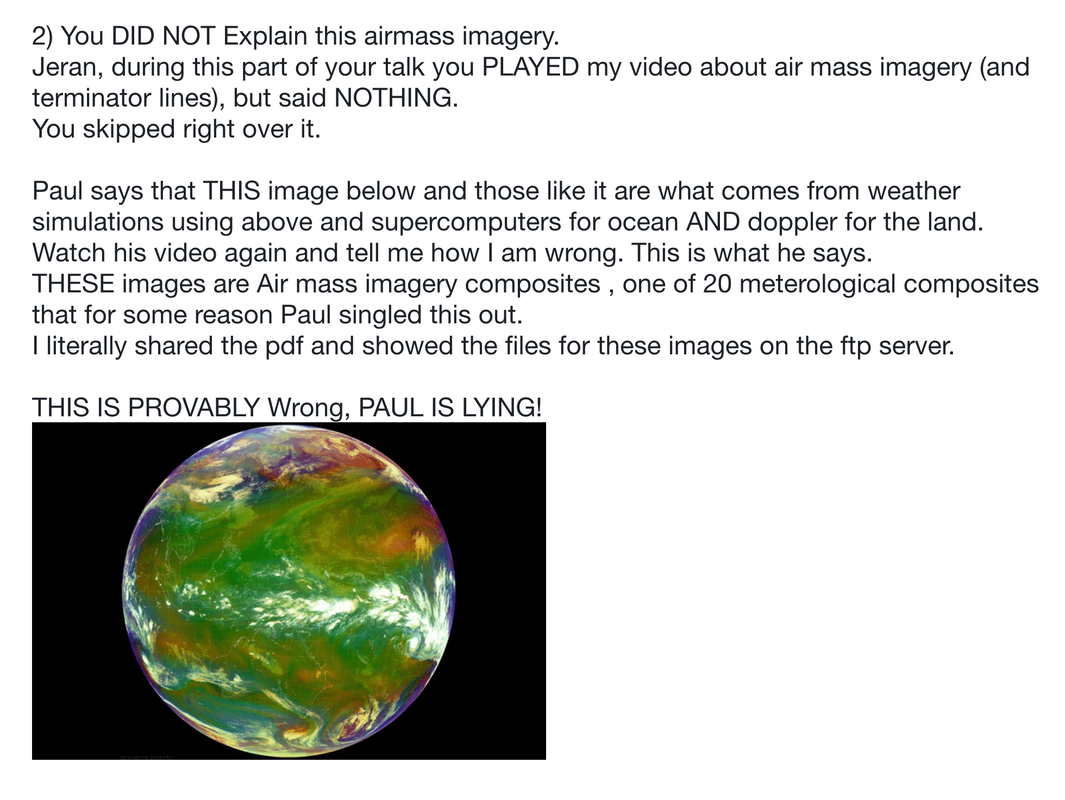
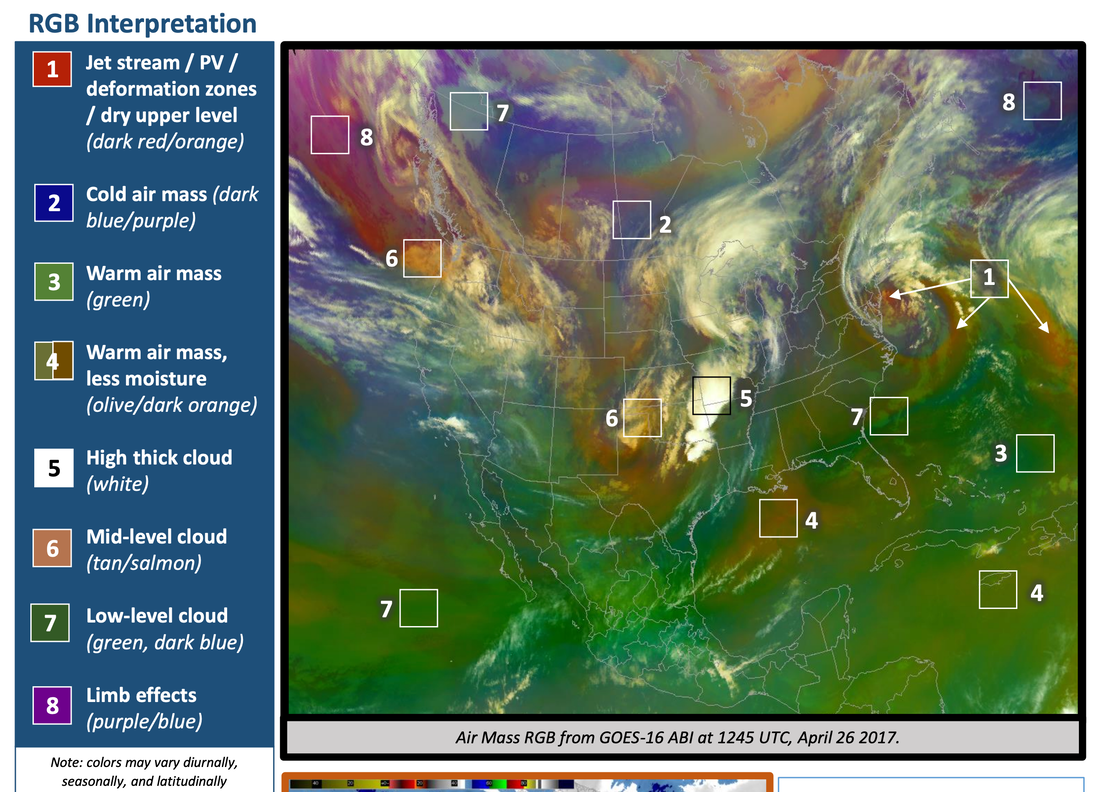
Air Mass imagery via the Himawari-8 satellite,
which shows temperature and moisture characteristics of air masses.
Learn more about how to interpret this type of imagery: bit.ly/3a8KxY3
It is not simply a photo. It is several photos in different wavelengths calibrated to detect different things.
The objective of the Himawari mission is not to prove that the earth is round, but to detect weather phenomena, smoke, &c.
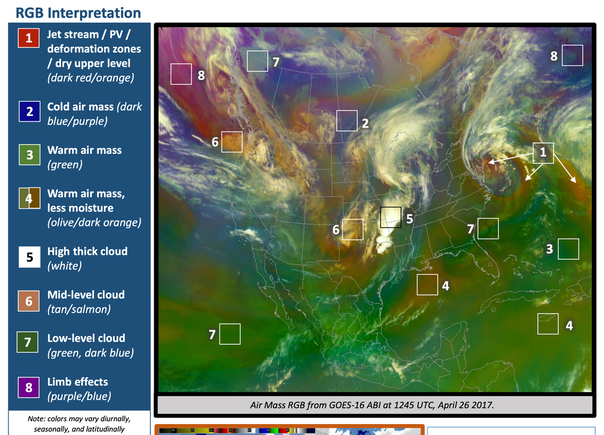
As RGB composite imagery
Air Mass imagery via the Himawari-8 satellite,
which shows temperature and moisture characteristics of air masses.
Learn more about how to interpret this type of imagery: bit.ly/3a8KxY3
It is not simply a photo. It is several photos in different wavelengths calibrated to detect different things.
Air Mass imagery via the Himawari-8 satellite,
which shows temperature and moisture characteristics of air masses.
Learn more about how to interpret this type of imagery: bit.ly/3a8KxY3
It is not simply a photo. It is several photos in different wavelengths calibrated to detect different things.


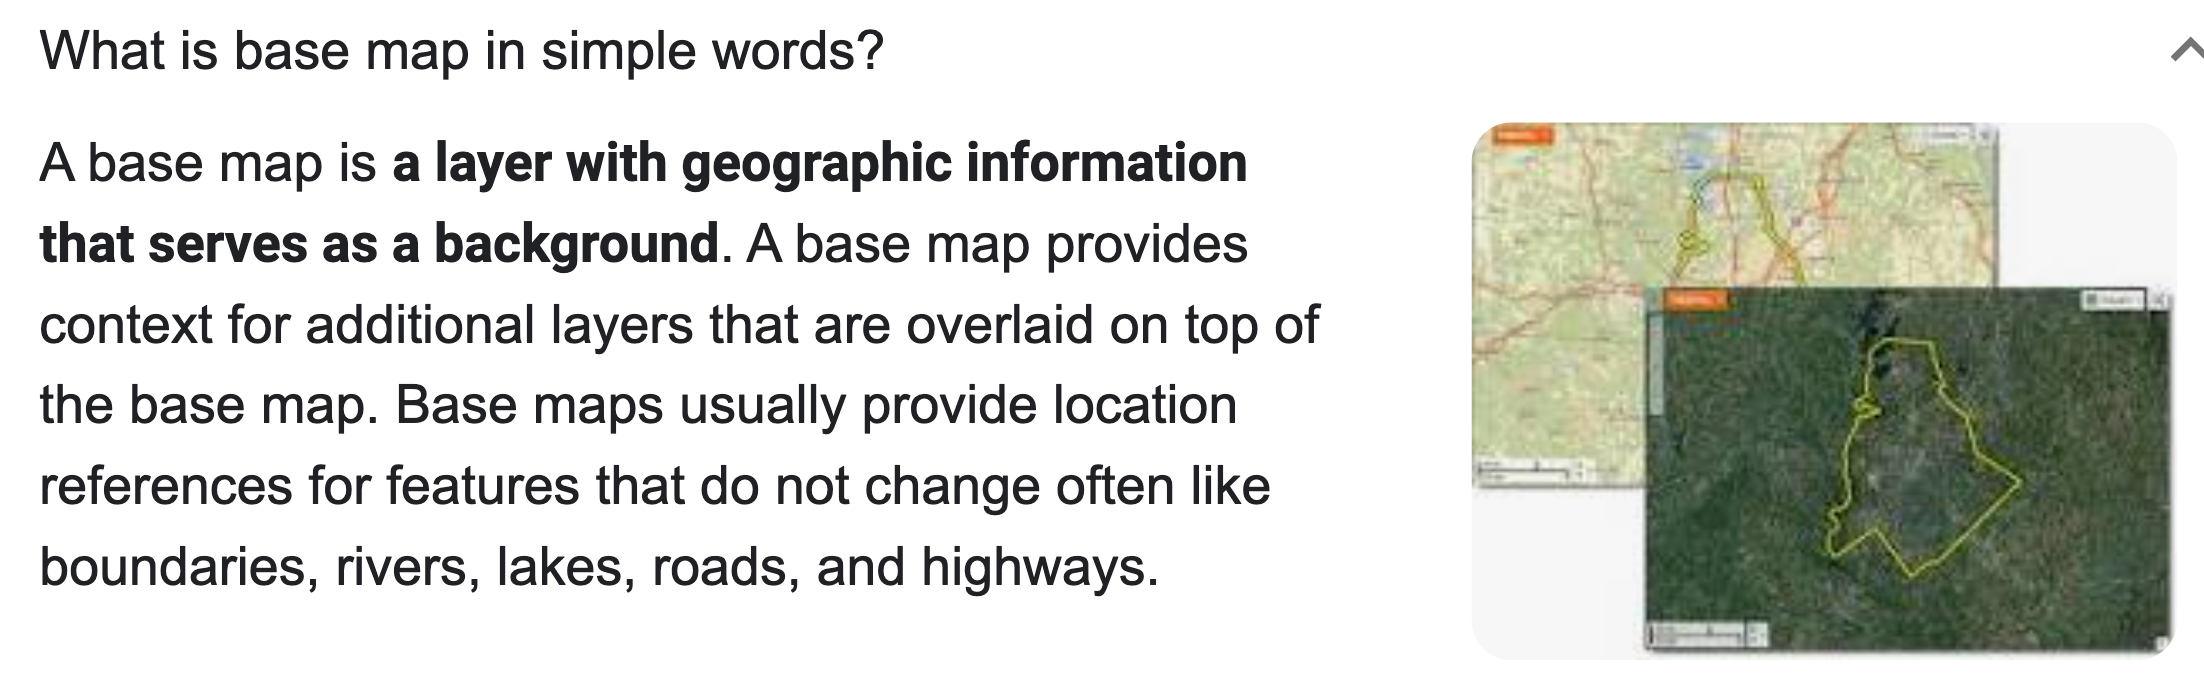
Basemap used so it can still see where the clouds are At night.
Also useful if we want to do an overlay of land masses and Country borders.
Note: even the real-color images are color-composites, like the false color images. But using the visible bands rather than the IR bands of course.
In most of the non-real-color images they use some background images. GOES uses the Blue Marble New Generation (BMNG) images. There can be overlayed some outlines additionally.
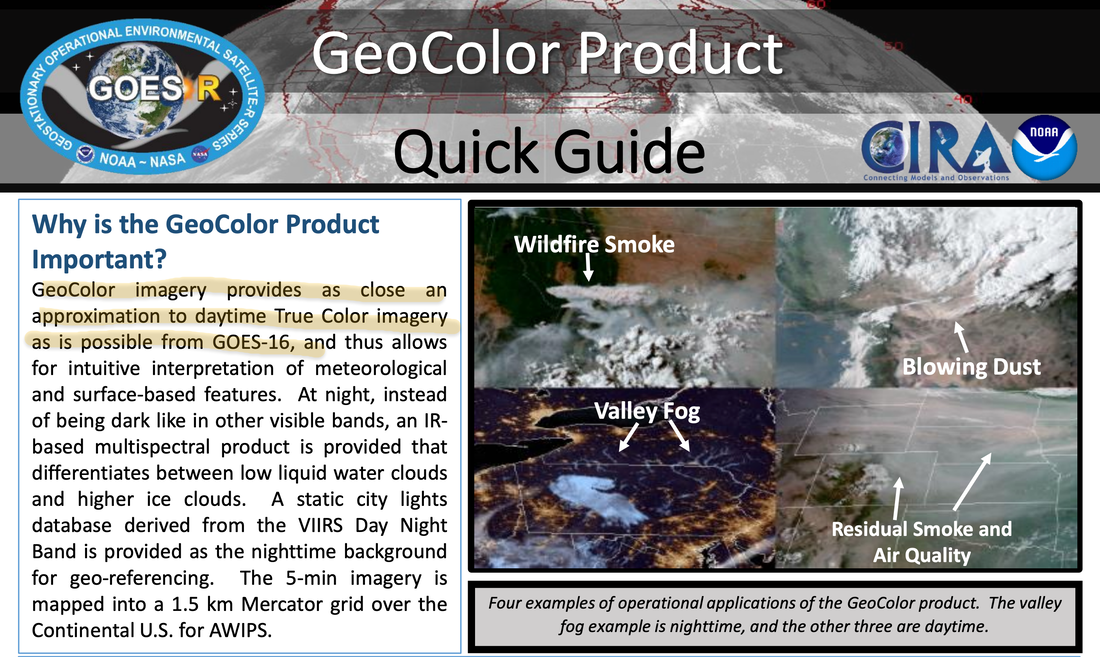
But on the GeoColor images they don't use the Blue Marble Background, see below GeoColor (CIRA).
At daytime on the GeoColor images they use no basemap. On nighttime they use infrared channels for the clouds and a city lights database derived from the VIIRS Day Night Band as a base image.
No Basemaps for Daytime GeoColor
More info:"PowerPoint Presentation (colostate.edu)
So no Blue Marble used for this data set.
Also useful if we want to do an overlay of land masses and Country borders.
Note: even the real-color images are color-composites, like the false color images. But using the visible bands rather than the IR bands of course.
In most of the non-real-color images they use some background images. GOES uses the Blue Marble New Generation (BMNG) images. There can be overlayed some outlines additionally.
But on the GeoColor images they don't use the Blue Marble Background, see below GeoColor (CIRA).
At daytime on the GeoColor images they use no basemap. On nighttime they use infrared channels for the clouds and a city lights database derived from the VIIRS Day Night Band as a base image.
No Basemaps for Daytime GeoColor
More info:"PowerPoint Presentation (colostate.edu)
So no Blue Marble used for this data set.

|
|
I did not say doppler cannot give cloud type of data,
I said it cannot give you accurate and detailed cloud cover.
I said it cannot give you accurate and detailed cloud cover.
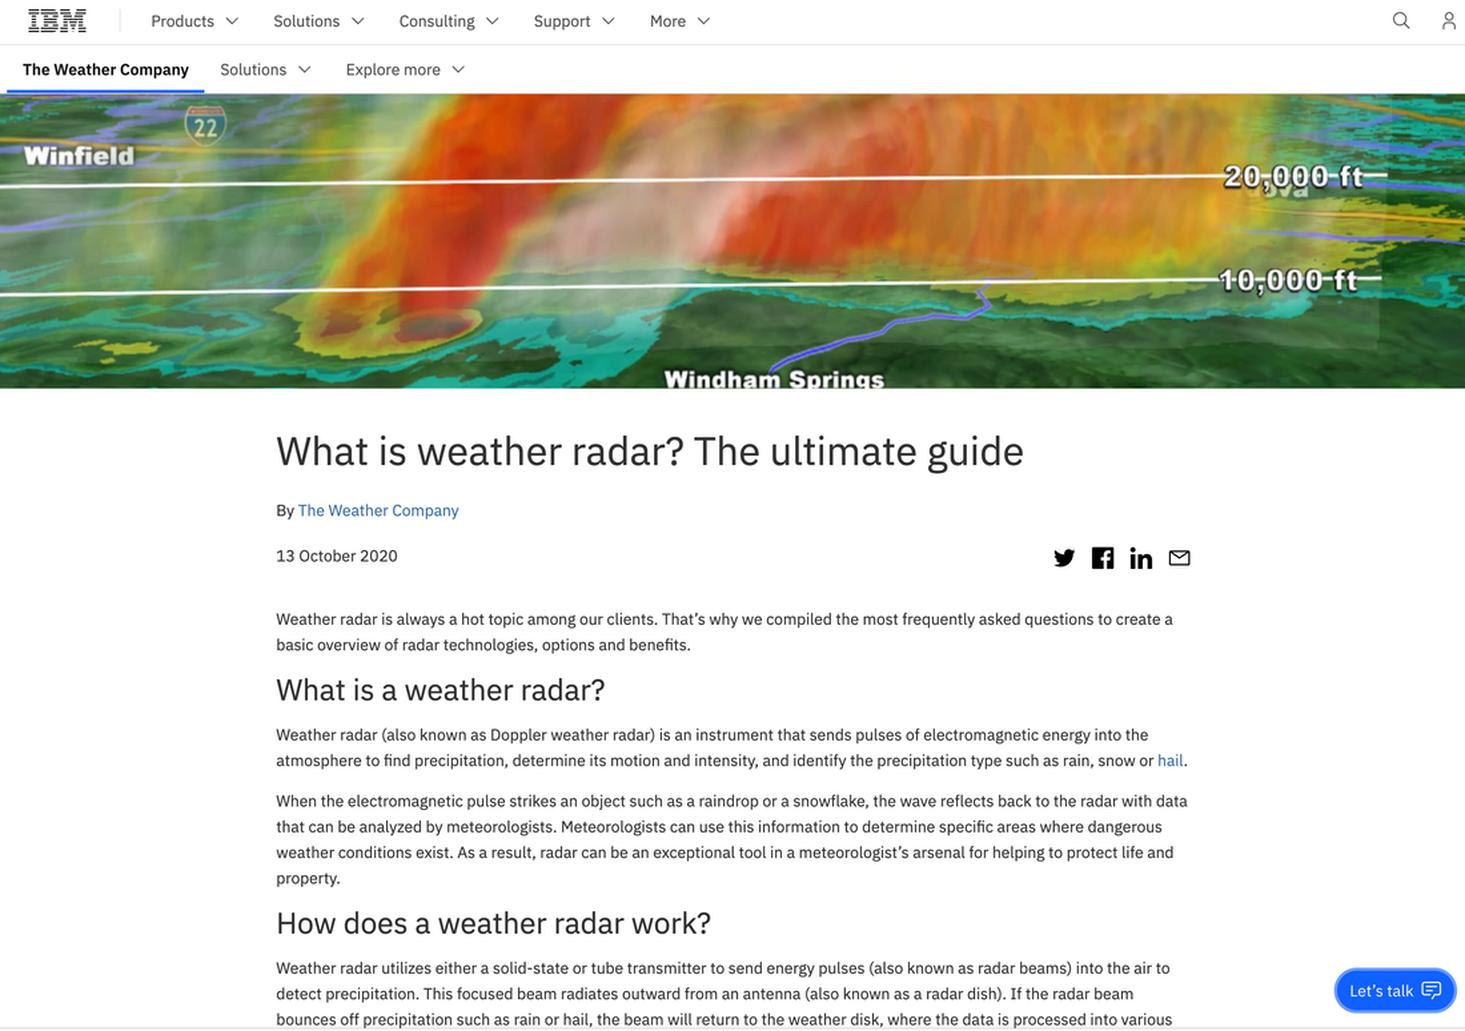
Weather Radar versus Satellites
Concentrate on the difference between weather radar and satellites/stratollites/balloons:
Limits of Radar
Concentrate on the difference between weather radar and satellites/stratollites/balloons:
Limits of Radar
- earth curvature: can’t see below a certain reason because the earth curves away
- occultation by nearby weather or objects
- wavelength limits the penetration ability -> short waves needed for clouds, but then no penetration at all (cloud shadows)
- need long wavelength to penetrate precipitation, but then clouds are not visible anymore
- the shorter the wavelength, the shorter the range
- much, much more radar device needed for earth coverage
- long distance radar are very heavy and expensive
- many separate radar types necessary to detect different weather features -> not feasible for whole continents
==> can’t make images of clouds not to speak of clouds from above! Only possible from huge high altitude balloons/stratollites
But mm radar can detect clouds, although their range is limited to tens of km. But they are cheaper so more stations can be used and connected to cover an area.
Determining height of reflected objects (ice, rain, hail)
==> Weather Radar take earth curvature and refraction off microwave into account and the scanning volume is restricted by earths curvature.
Limited Range for Radar that can detect Clouds
„Cloud particles with diameters in the range from 5 to 10 μm are most often too small to be detected by centimeter-wavelength radars. To detect cloud particles reliably, shorter millimeter-wavelength radars are necessary.
However, the drop in atmospheric transmissivity from centimeter to millimeter wavelengths limits the range of millimeter-wavelength radars. In precipitation-free conditions a range of tens of kilometers is possible, but with the onset of precipitation the useful observation range decreases.“
http://radarscience.weebly.com/radar-technology.html
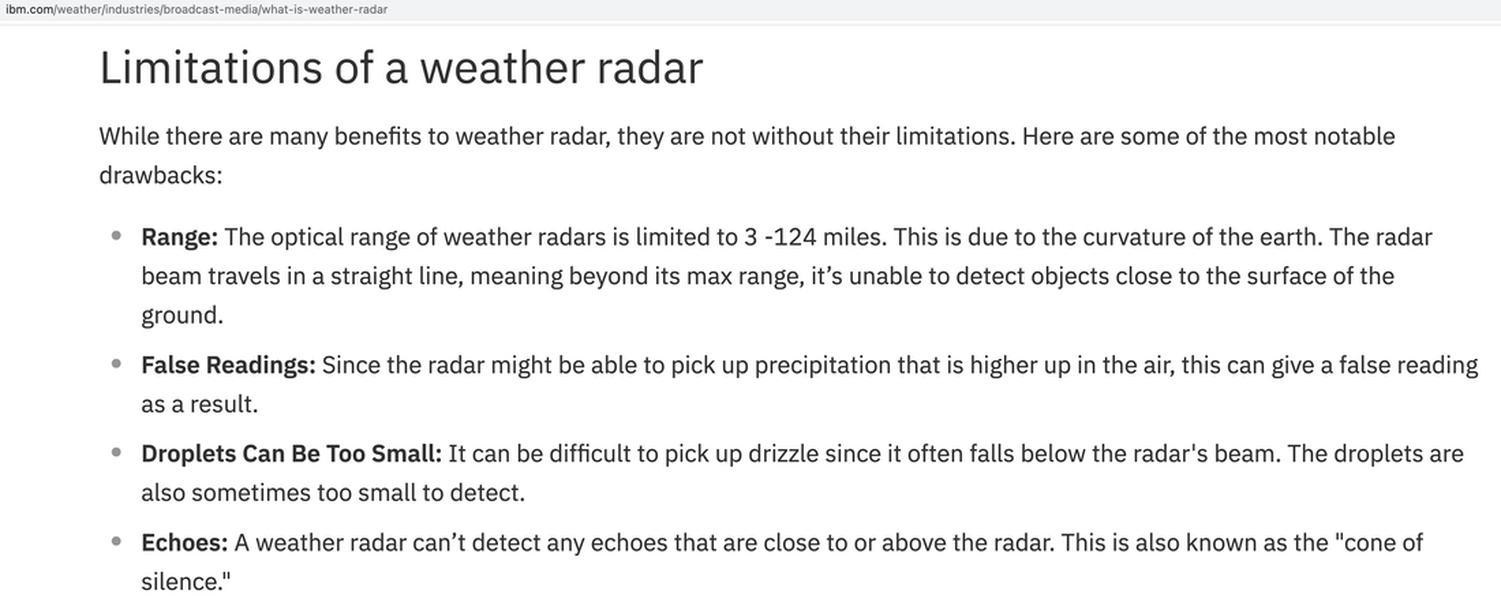
Cone of silence above the radar
„A weather radar can't detect any echoes that are close to or above the radar. This is also known as the "cone of silence."“
https://www.ibm.com/weather/industries/broadcast-media/what-is-weather-radar
Satellites like Himawari and GOES can do much more than Radar
- detect light and infrared, so they see completely other things than what radar can detect
- free global coverage, no stitching
- How can events like volcanic eruptions, bushfires ect. be stimulated by weather software in real time? This events can not be predicted.
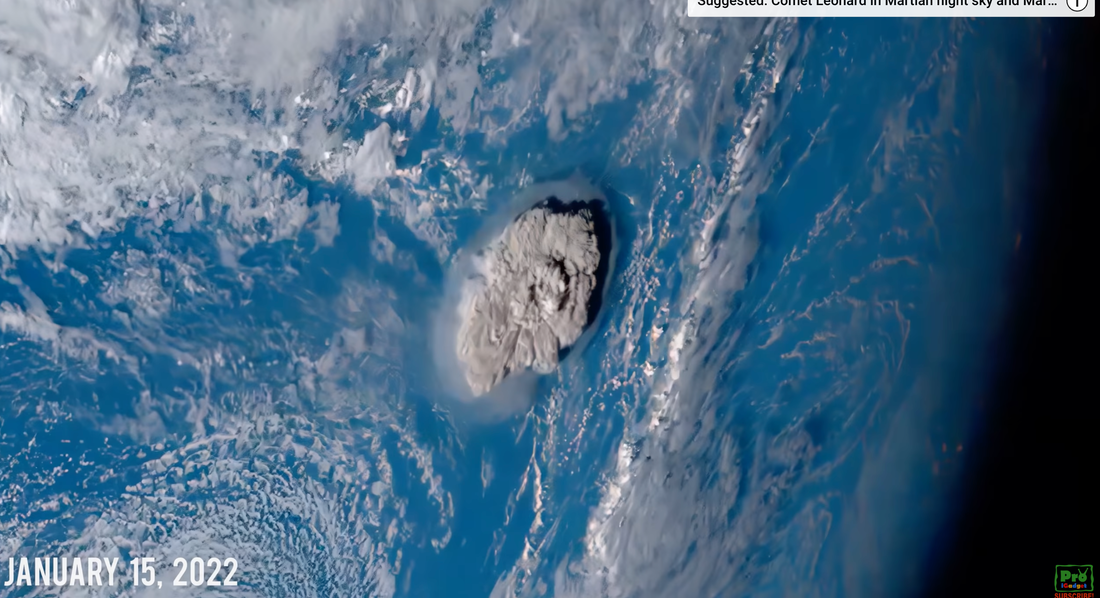
- We have even seen the pressure wave of a volcano recently on the Himawari how it moved around the globe and was registered in real time on every weather station on earth in a way only possible on a globe.
The Tonga volcano also proved the images were real. Tonga was offline for weeks yet we had images of the eruption and the aftermath right away. One flerf insisted it was all from ground stations, which magically worked when the entire island was offline.
|
|

This sequence shows wildfires from Northern California from 2017 from GOES-16
Solar Eclipse from Himawari

Stratollites
https://worldview.space/remote-sensing/
- Stratollites (SL) are huge and easily visible even without a camera. Where are they?
- SL are a relatively recent technology. Satellites existed long before
- Used only for local observations in high resolution
- „Stratollites combine the benefits of geostationary satellites, LEO satellites, and high-altitude drones“. So they admit that there are satellites.
https://www.geekwire.com/2016/15-million-deal-gives-a-lift-to-spaceport-tucson-and-world-views-balloon-venture/
Problems with Balloons
https://youtu.be/BfvMS76whEU
- Radar systems are heavy and need a lot of power. That requires big balloons. Some expand to the size of stadiums like the Superdome (NASA).
- Why can’t we see this balloons with a Nikon P1000? Ca (50-60 Pix)^2 on the 16 MPix sensor for a 6 m balloon at 100,000 ft expected. Much more for balloons with attached radar or Stratollites.
- All balloon companies explicitly state that balloons complement the existing satellites. They cannot replace them. So they „admit“ that weather and observation satellites do exist!
- Where are all the ships to launch them over sea, maintenance?
- stitching together clouds that are mostly viewed from the sides when only few balloons per area are used, due to the limited altitude (is now stitching images not CGI anymore? like the Blue Marble)
- very complicated data processing (remove perspective distortion, stitching, motion removal,…), versus 1 Satellite for 1/2 earth coverage with no image stitching needed
https://youtu.be/BfvMS76whEU
Jeran Doesn't Get GPS
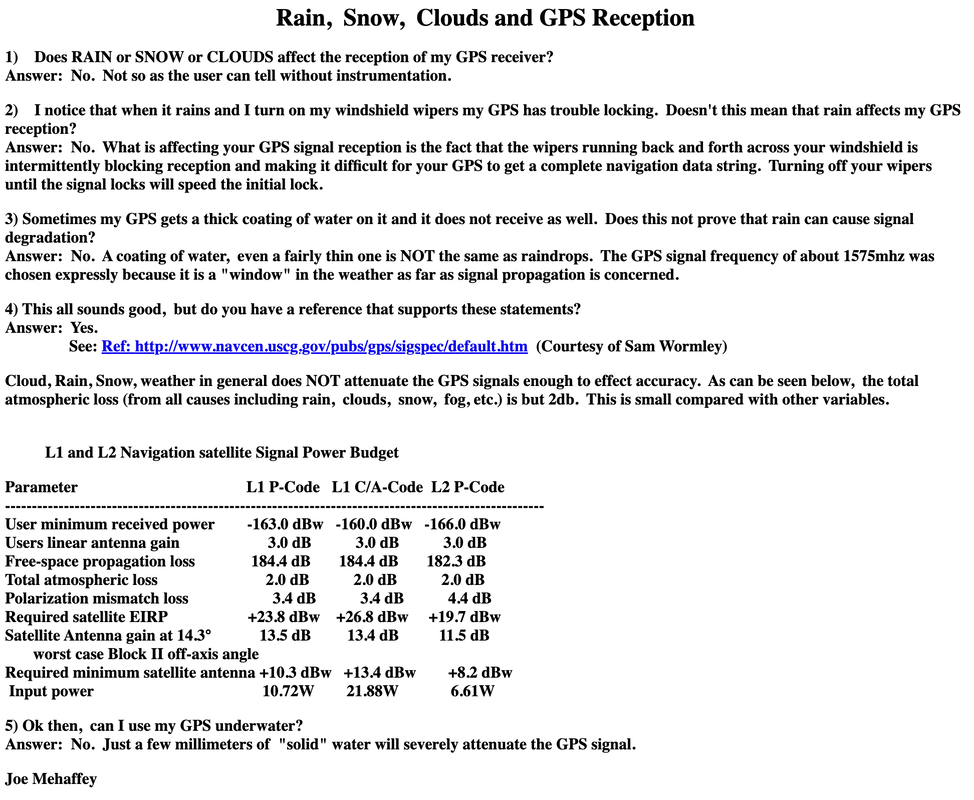
The GPS signal frequency of about 1575mhz was chosen expressly because it is a "window" in the weather as far as signal propagation is concerned.
http://gpsinformation.net/gpsclouds.htm
The GPS signal frequency of about 1575mhz was chosen expressly because it is a "window" in the weather as far as signal propagation is concerned.
http://gpsinformation.net/gpsclouds.htm
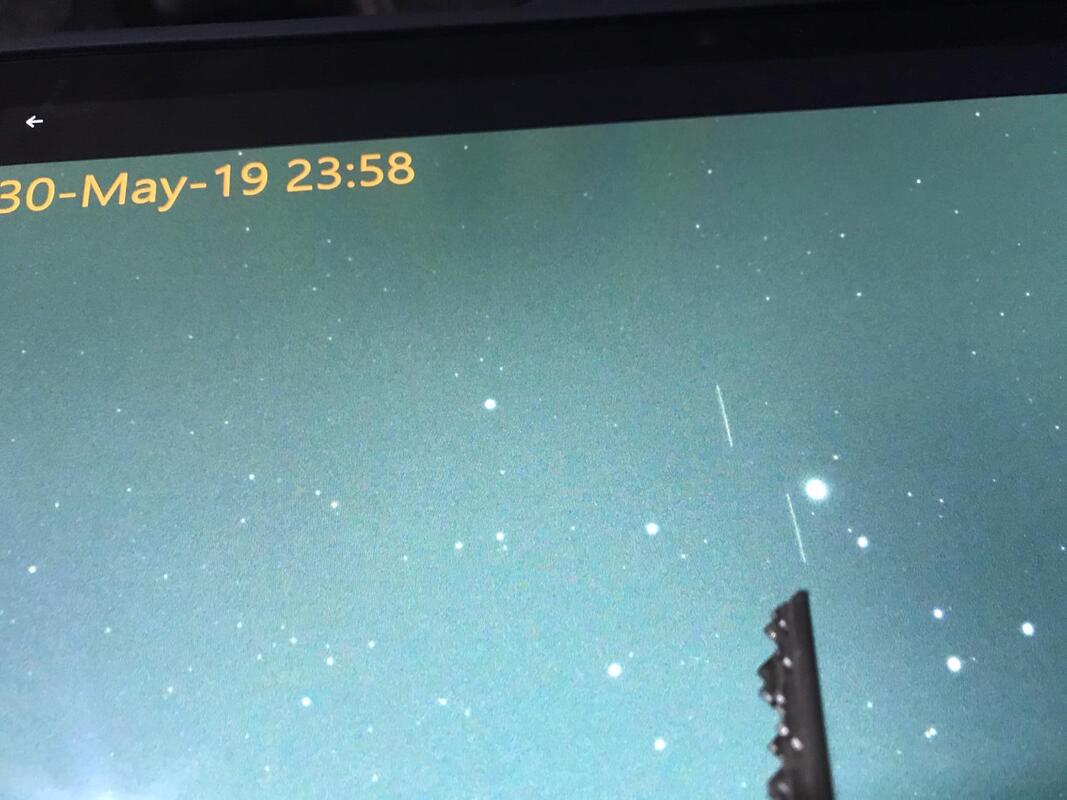
Jeran Doesn't Get Geostationary
Wolfie shows streaks in the sky while filming geostationary satellites if those satellites are standing still relative to one location on Earth. Jeran doesn't understand that the satellites form streaks when Wolfie tracks the background stars. Alternatively, when the satellites are being tracked, the stars are the ones forming streaks.
Wolfie shows streaks in the sky while filming geostationary satellites if those satellites are standing still relative to one location on Earth. Jeran doesn't understand that the satellites form streaks when Wolfie tracks the background stars. Alternatively, when the satellites are being tracked, the stars are the ones forming streaks.
- satellites can be observed on long exposure images through telescopes at the predicted geostationary locations
I want to see that!
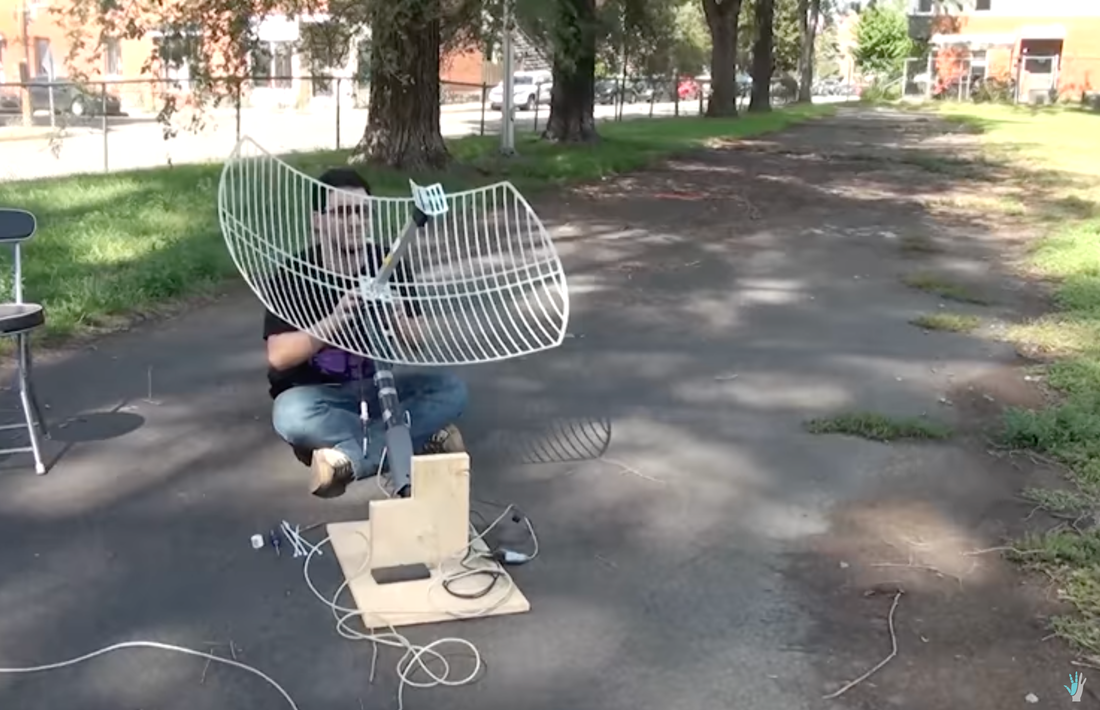
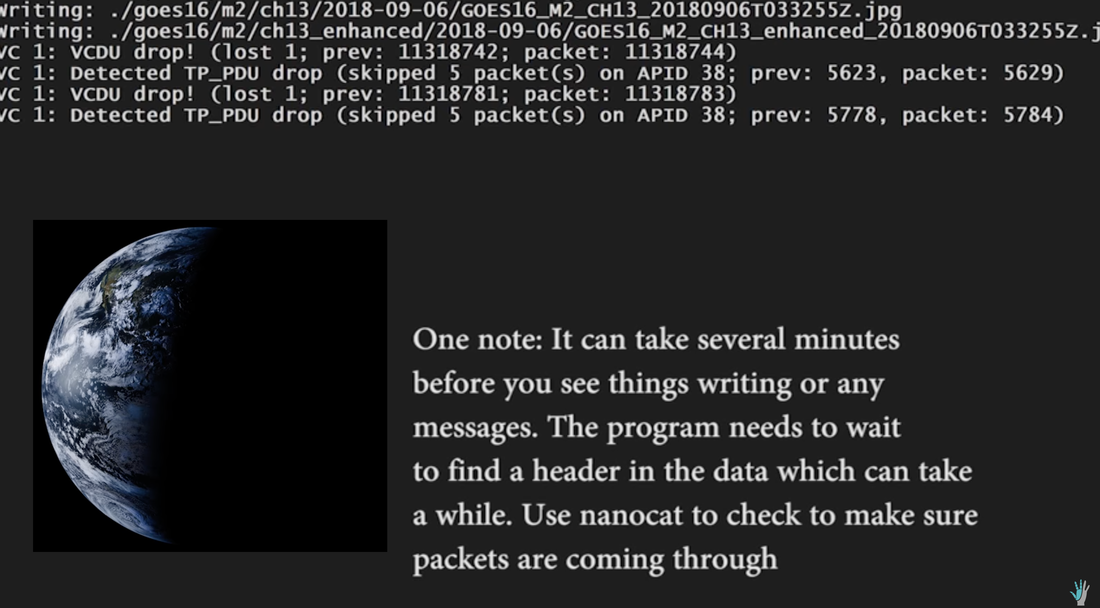
- raw signals can be received by homemade antennas and receivers and the raw images of the whole earth can be decoded on a PC. (no signals from the alleged balloons can be found)
- The home made antennas have to be directed towards the known locations of the geostationary satellites
Globe Earth and beyond
walter.bislins.ch
walter.bislins.ch/bloge/?page=Globe+Earth+and+beyond&qs=%2361
Building your own receiver
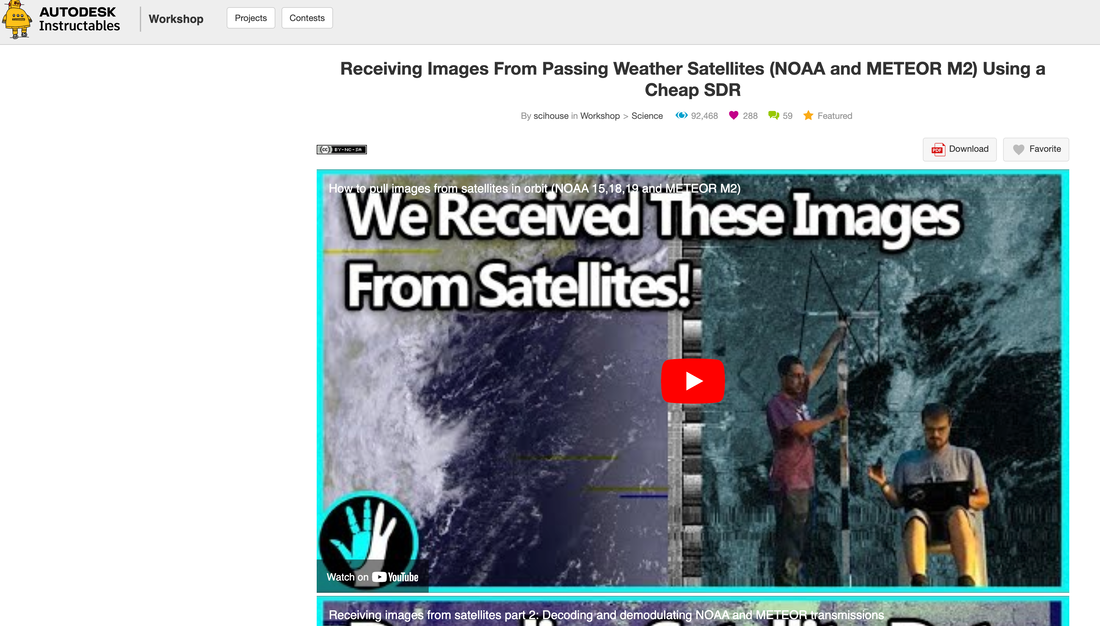
NOAA/NASA encourages users to build their own receivers so all the data can be downloaded and decoded by DIY receivers like described in detail here:
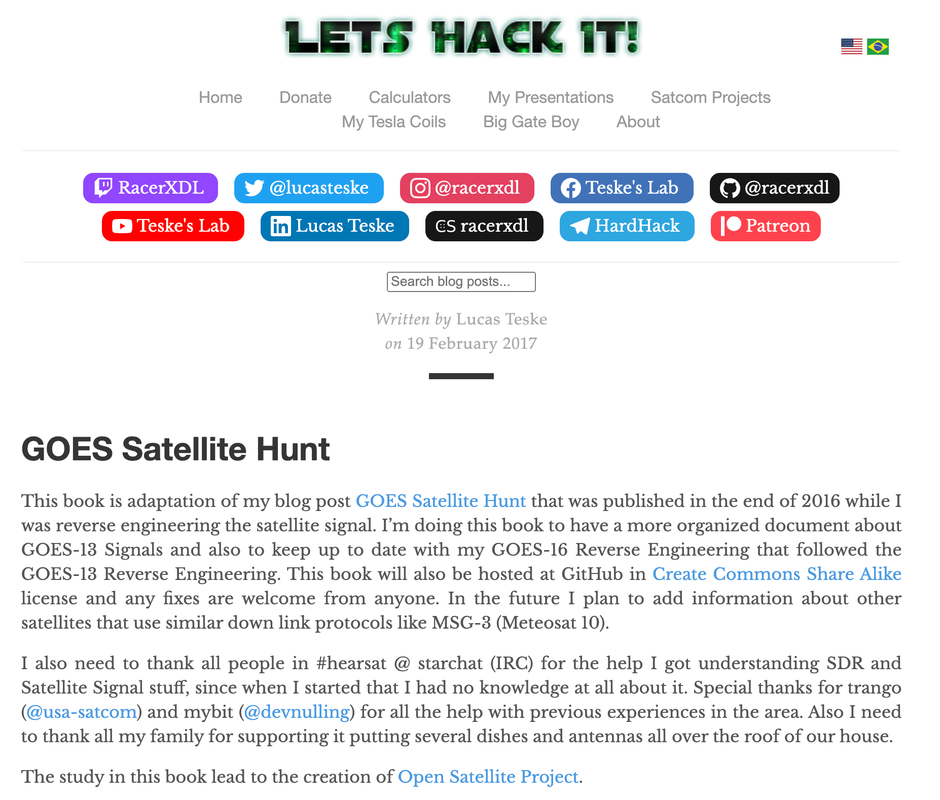
How to Pull Images from Satellites in Orbit
GOES Satellite Hunt | Lets Hack It (lucasteske.dev)
Receiving Images From Passing Weather Satellites (NOAA and METEOR M2) Using a Cheap SDR : 10 Steps (with Pictures) - Instructables
|
|
1. Himawari-8: Destroying Flat Earth Every 10 Minutes
**22,000 miles away, real picture every 10 minutes*
**22,000 miles away, real picture every 10 minutes*
Full image of globe every 10 minutes (144 per day)
*20 lines of scanning (stitch lines) - 21% savings
11,000 x 11,000 state of the art in weather observation -Oblateness of globe (1/2 kilometer to 2 kilometers.
*Advanced Himawari Imager (AHI) is a Multispectral Camera with sixteen channels (0.46 µm to 13.3 µm)
-The spectrum is recorded with 3 overlapping independent delivers gray scale image data: red, green and blue channels. If these channels are superimposed, a so-called true color image is recreated.
*true-color imagery tool visualizing:bushfires, dust storms, volcanic eruptions, and even solar eclipses
*The camera provides cloud, temperature, wind, precipitation, and aerosol distribution data over the various spectral ranges.
It is not simply a photo. It is several photos in different wavelengths calibrated to detect different things. The objective of the Himawari mission is not to prove that the earth is round, but to detect weather phenomena, smoke.
Because while we can appreciate this pictures for their beauty these are actually meteorological satellites!
The data that comes down is important for predicting weather and other things.
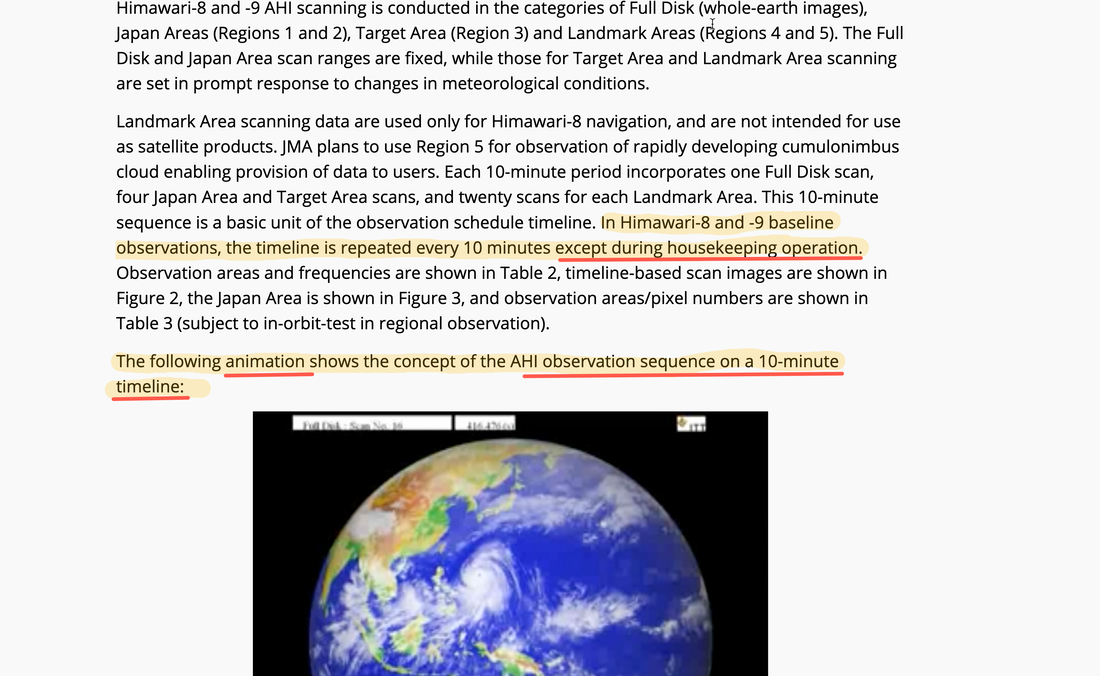
This 10-minute sequence is a basic unit of the observation schedule timeline. In Himawari-8 and -9 baseline observations, the timeline is repeated every 10 minutes except during housekeeping operation.
There's also the fact that "composite" has many different meanings as it applies to photography. All color images, be they photographs on film or full motion video are composites of red, green and blue components. So are all pictures fake?
And because there's no single piece of silicon with 11,000 x 11,000 pixels, the AHI must mechanically scan a smaller imager across the field of view, and do it all over for each of the 16 different wavelength bands it captures. That's exactly how TV works!
I would like to ask, what is the problem with having information on the weather 10 minutes old?
Kept Harping about every 10 minutes and somehow they think it is 25 or 30 minutes.
They clearly did not research on this! The are projecting onto me the very thing they did...
They clearly did not research on this! The are projecting onto me the very thing they did...
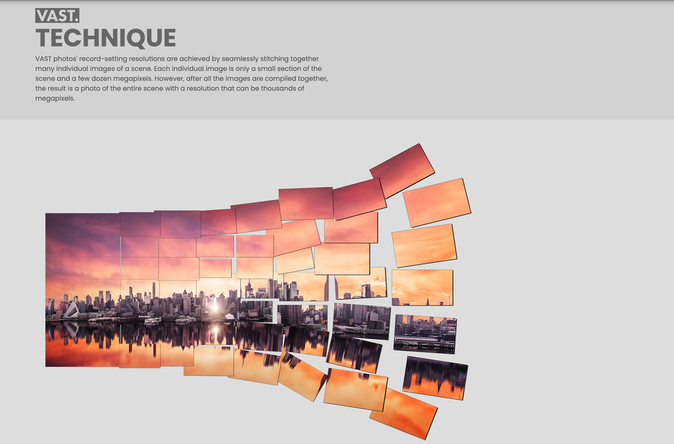
https://vastphotos.com/technique/
|
|
https://www.data.jma.go.jp/mscweb/en/himawari89/space_segment/spsg_ahi.html
|
|
The spectrum is recorded with 3 overlapping independent channels which delivers gray scale image data for each of the color channels: red, green and blue. If these channels are superimposed, a so-called true color image is recreated.
2. SunFlower - Radiance, Respect, Hope, Recovery
As spring brings warmer temperatures in the northern hemisphere, flowers are beginning to bloom again. In Japanese culture, each bloom conveys specific emotions and messages. This symbolism is known as hanakotoba or “the language of flowers” in English and reflects the physical attribute of each plant, as well as its presence in art and literature.
Although not native to the land, sunflowers are well-loved in Japan. They symbolize radiance and respect. There is even an annual festival dedicated to Sunflowers called the "Hokuryu Sunflower Festival," which takes place in August and July.
https://www.cultureready.org/blog/japans-secret-language-flowers
|

|
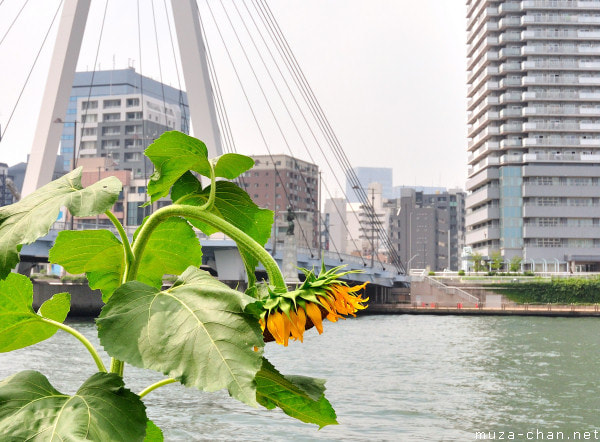
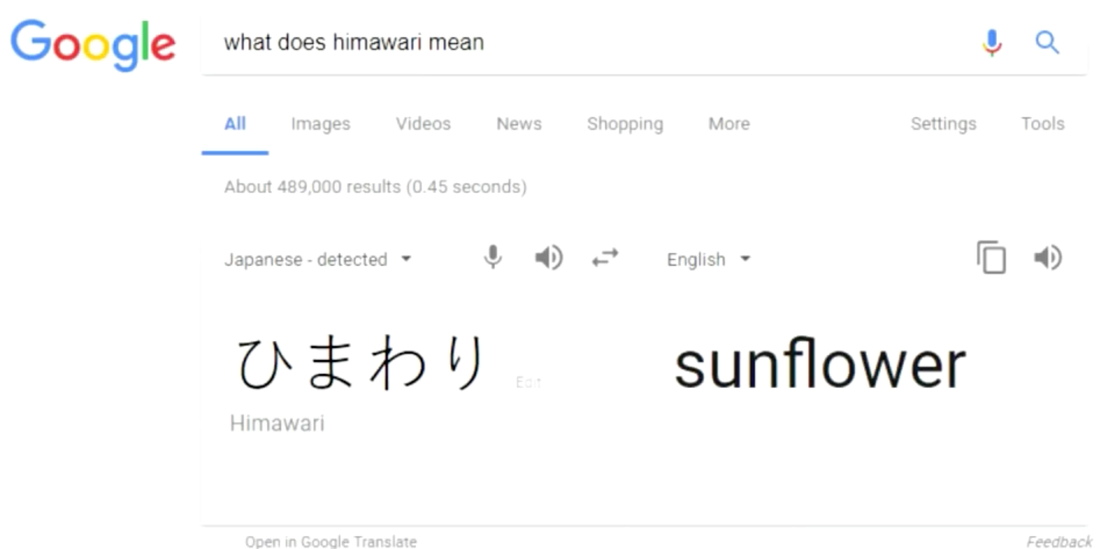
Himawari, the Symbol of Hope and RecoveryWed, July 20, 2011, by Muza-chanThe Sunflower (ヒマワリ - himawari in Japanese) is a popular plant in Japan, where it has been cultivated since the 17th century.
A very interesting fact is that the sunflower has unusual properties, being able to extract from the soil toxic substances, like lead, arsenic or uranium. More than this, after the Chernobyl accident, it has been observed in Ukraine that the sunflower can extract the cesium-137 and the strontium-90 from the soil. The explanation is that radioactive cesium is somehow similar to kalium (potassium), a commonly used fertilizer, and if kalium is not present, the sunflowers will absorb cesium instead!
So, following the observations from Ukraine, a campaign started recently in Japan to sow sunflowers on the fields around the Fukushima Daiichi nuclear power plant. After harvesting, the plants will be decomposed, so only a small amount of radioactive waste will remain.
That way, himawari becomes a symbol of hope and recovery for Japan…
ftp://ftp.nnvl.noaa.gov/
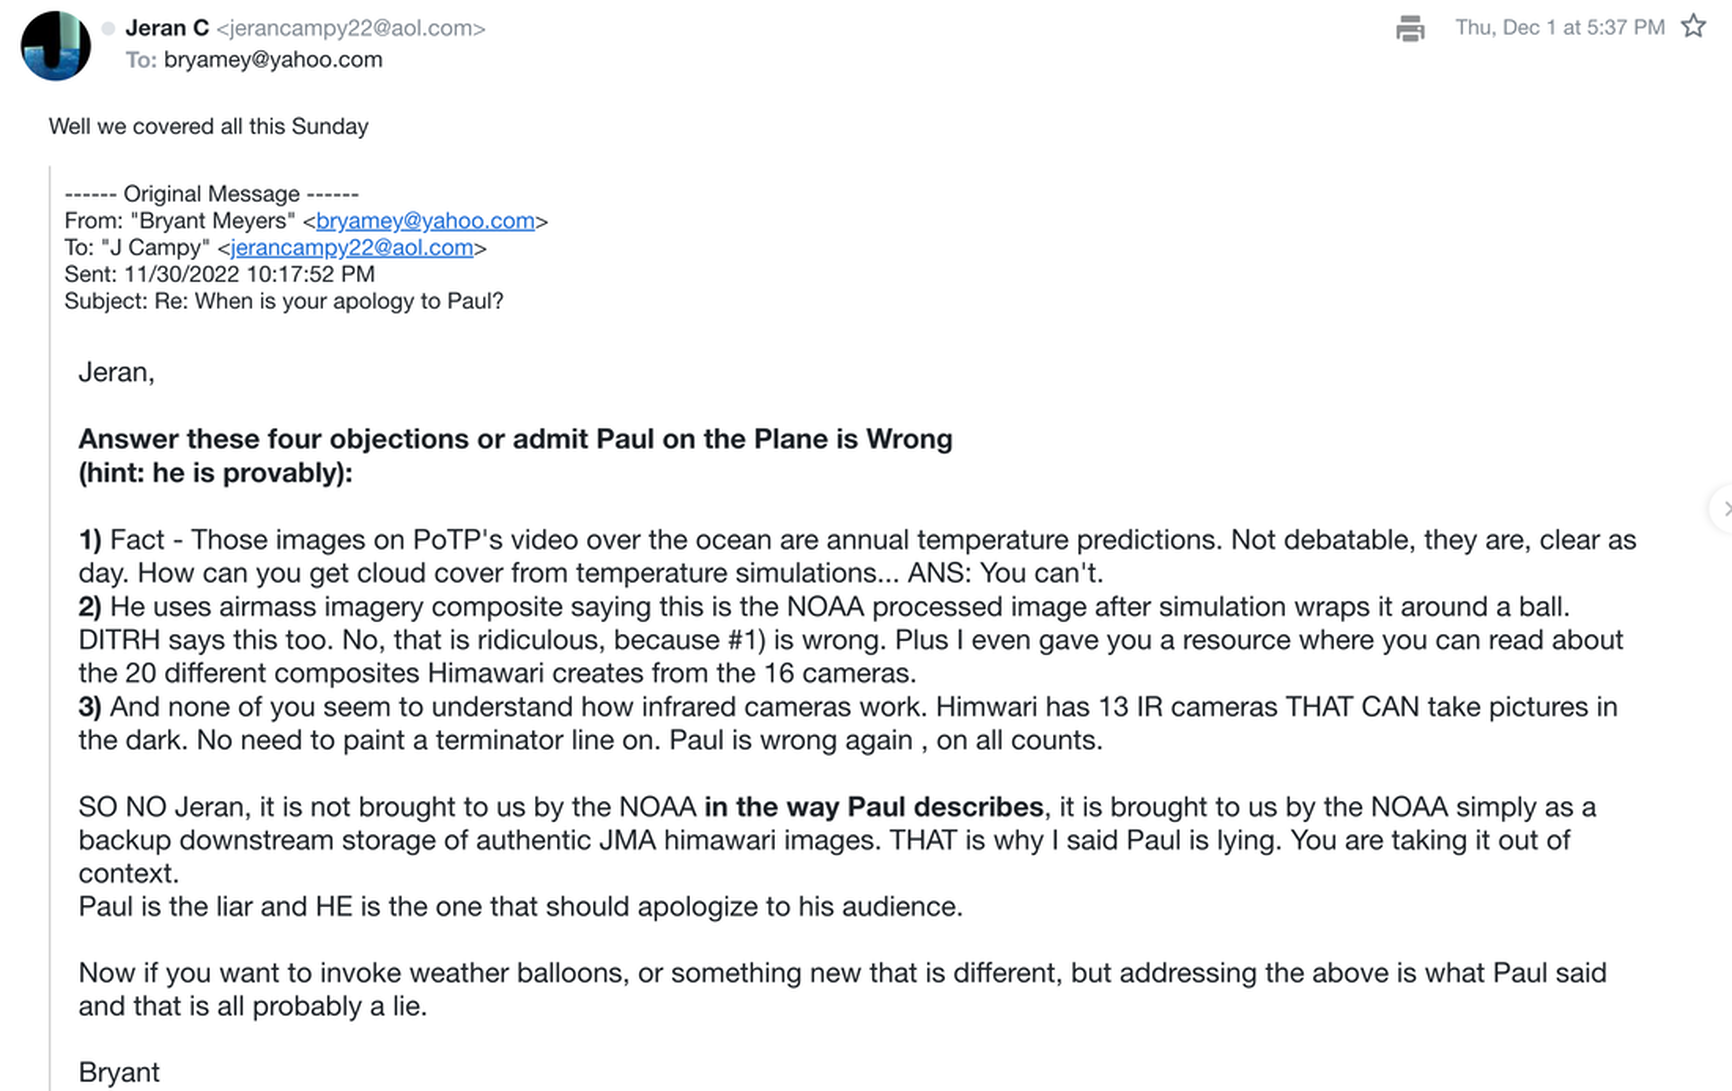
PotP is essentially referencing the wrong ftp archive, NOAA. Which is the thrust of the entire argument. NOAA is just a downstream archive. He should have been looking at the Himawari 8 JMA ftp (Japan Meteorological Agency). That's where the actual source data is, not NOAA.
He states that this is even admitted in the file SiteDescription.txt on the server.
The cited text file SiteDescription.txt on the nnvl noaa gov FTP server was created on 2017-02-01. Comparing the contents of the txt file with the directory structure of the FTP server we can see, that the directory structure has changed since then and the description is outdated. The GOES/Himawari directory was added to the server at 2017-12-14, i.e. after the last update to the SiteDescription. The Himawari directory is not mentioned in the SiteDescription.txt file and the following paragraph does NOT apply to the Himawari images, which are unmodified copies of the JMA Himawari website, as can be confirmed by downloading and comparing images from the JMA website:
Cite from the SiteDescription.txt:
Trying to Connect Himawari to NOAA/NASA
Obviously being a flat earther he wants to connect this all to NASA
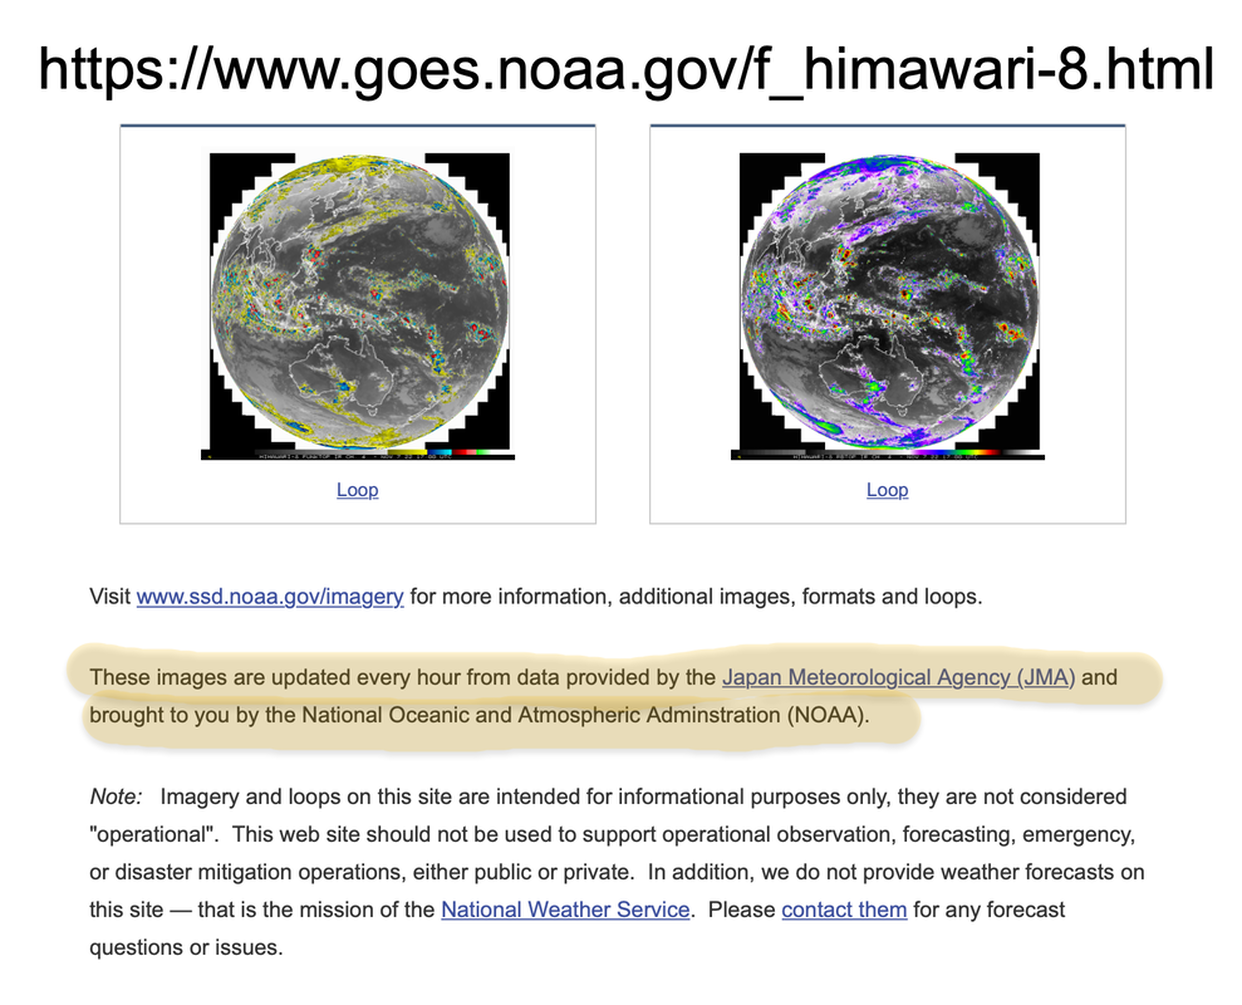
https://www.goes.noaa.gov/f_himawari-8.html
Obviously being a flat earther he wants to connect this all to NASA
https://www.goes.noaa.gov/f_himawari-8.html
3. Wrong Paul, Blue Marble Data NOT used for Himawari!
Not even always used for GOES!
Not even always used for GOES!
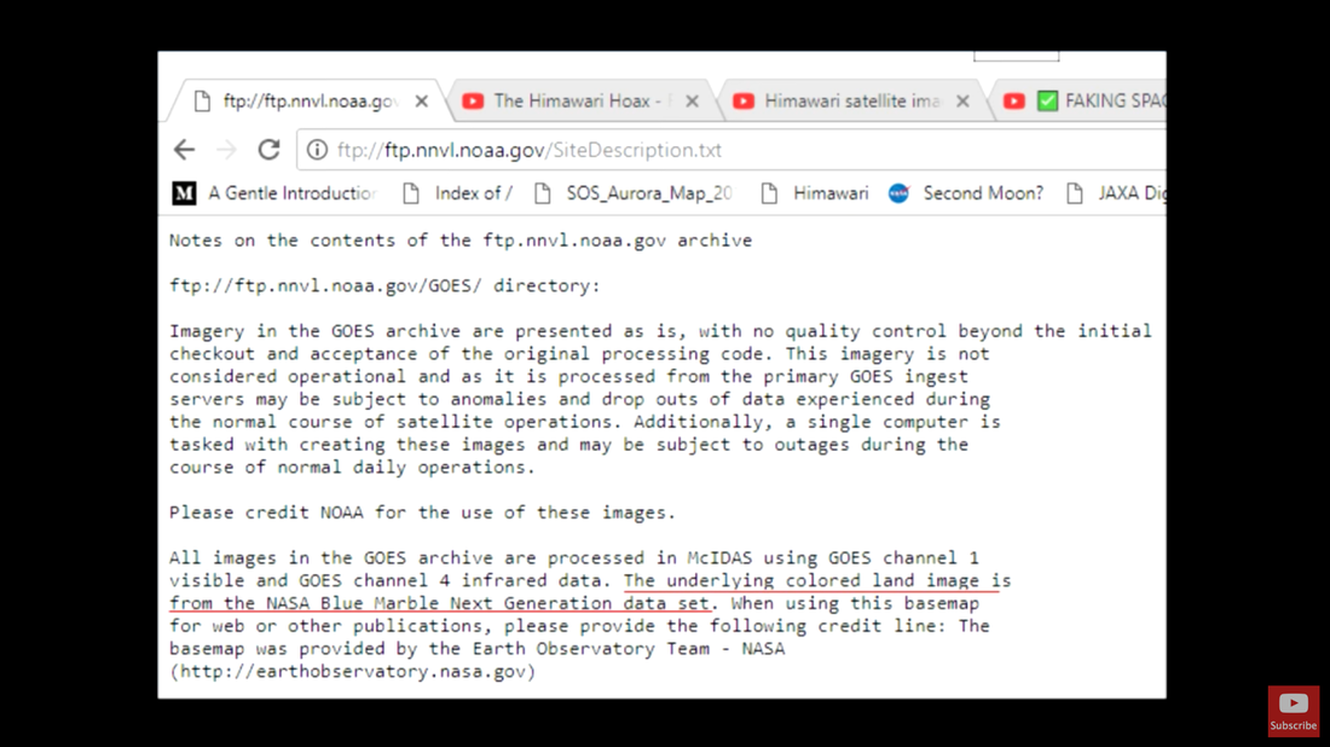
"All images in the GOES archive are processed in McIDAS using GOES channel 1 visible and GOES channel 4 infrared data. The underlying colored land image is from the NASA Blue Marble Next Generation data set. When using this basemap for web or other publications, please provide the following credit line: The basemap was provided by the Earth Observatory Team - NASA"
NOAA, NASA and GOES have no connection to Himawari other than maintaining unaltered copies from the JMA servers on their FTP server. The Himawari images on the NOAA FTP server are NOT processed and are real photos of the earth.
***Paul's confusion comes from Himawari images being listed on the FTP server. Seeing that and the citation from SiteDescription.txt, he concluded that data is overlaid on the Blue Marble to produce Himawari images.***
https://sos.noaa.gov/catalog/datasets/blue-marble/
GOES
Only SOME of the GOES processed images use the Blue Marble New Generation BMNG background and overlay the cloud images from the GOES infrared channel 4 onto it. This is not the case for all GOES images. GOES does also provide real color images called GeoColor images, but the night part of the earth uses the infrared channels to depict the clouds at night. The day part of the GOES GeoColor images are real color RGB photos, no Blue Marble background used.
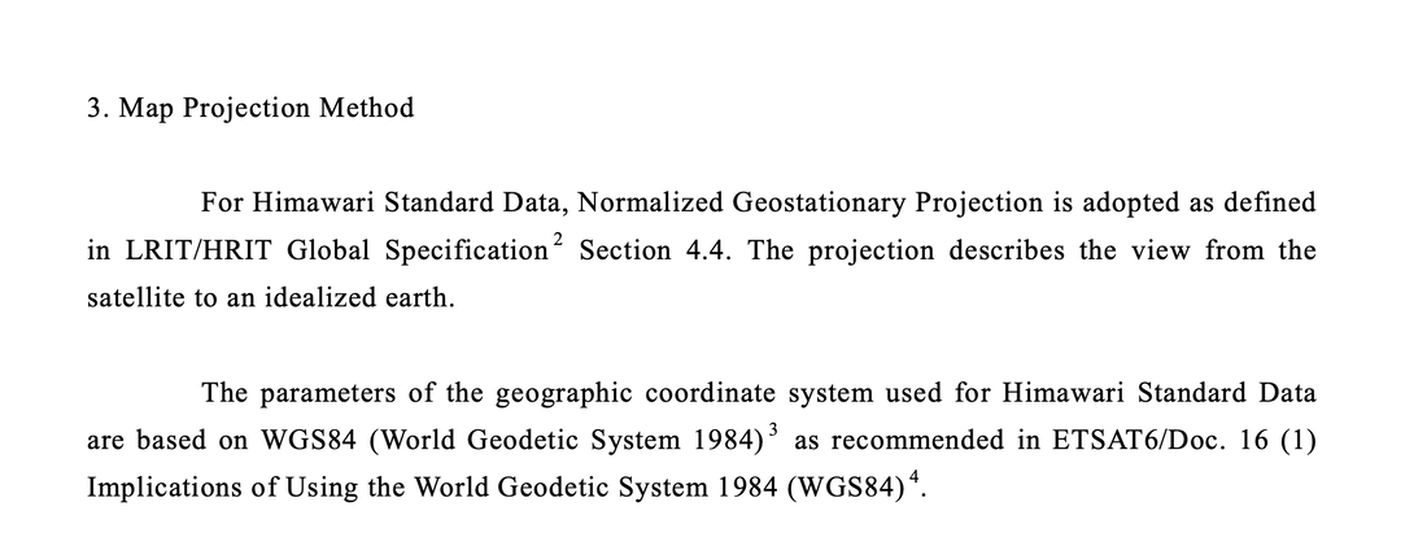
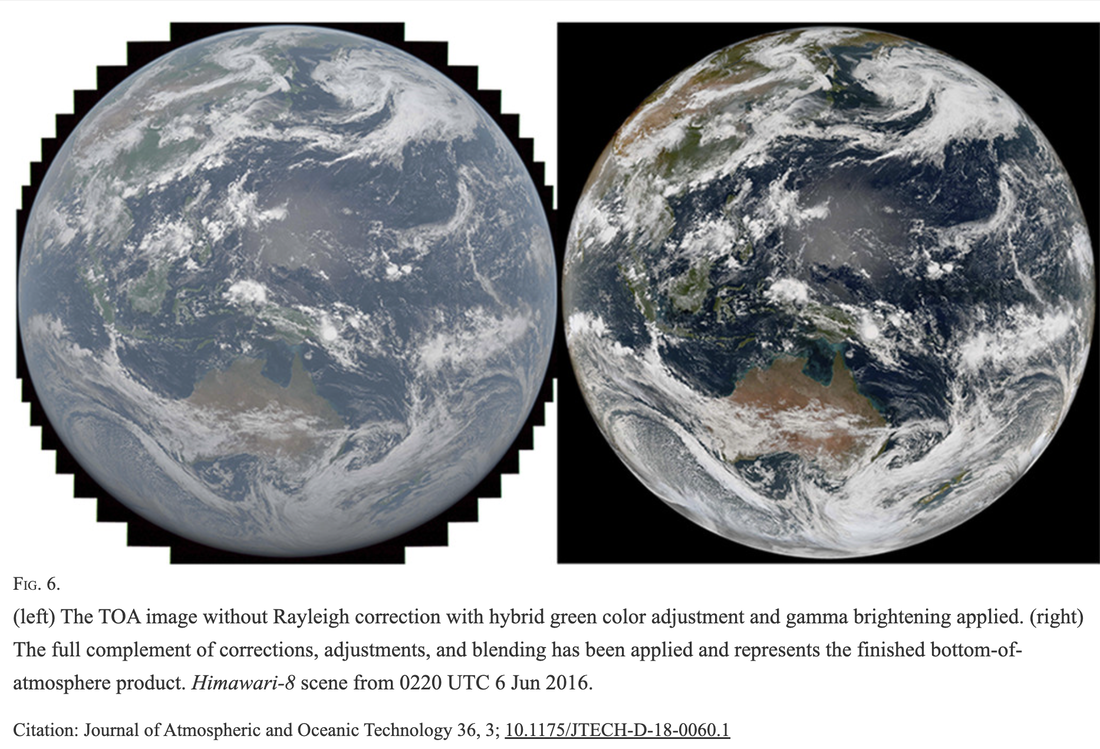
The japanese JMA website states explicitly that the full disk true color images of the Himawari 8 satellite are real time photos (every 10 minutes) using the satellites RGB channels and 1 infrared channel (to restore some missing green channel range). This are real time color photos of the whole earth, no CGI, no Blue Marble, no simulations.
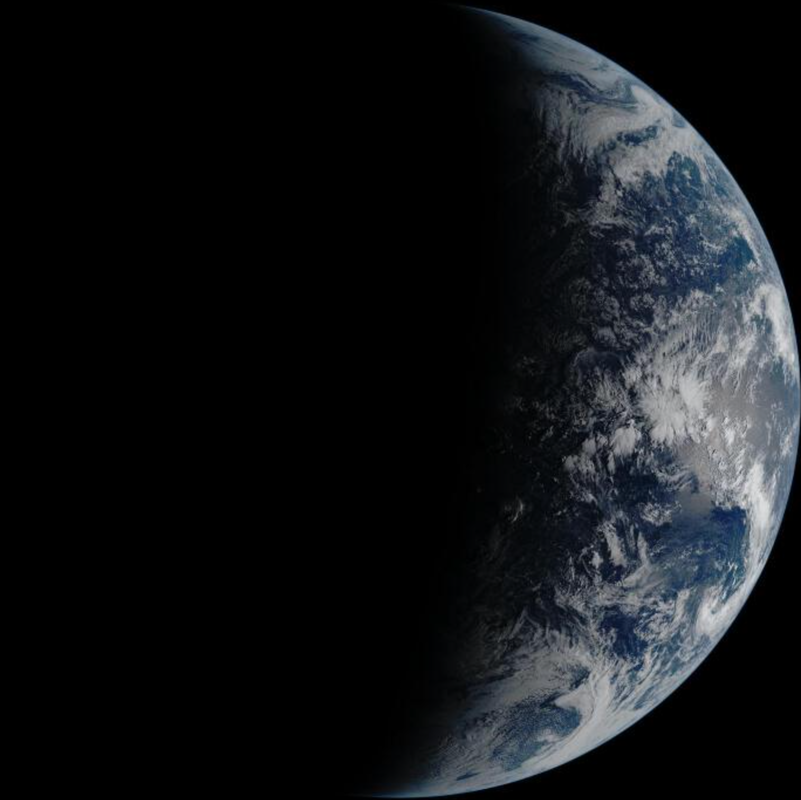
The Himawari has beside the 3 RGB channels 13 infrared channels (total of 16 channels). Clouds are visible in infrared at night. The night sides on some processed Himawari images are created using the infrared channels. Again, no CGI, no simulation, real infrared photos of the whole earth.
Only SOME of the GOES processed images use the Blue Marble New Generation BMNG background and overlay the cloud images from the GOES infrared channel 4 onto it. This is not the case for all GOES images. GOES does also provide real color images called GeoColor images, but the night part of the earth uses the infrared channels to depict the clouds at night. The day part of the GOES GeoColor images are real color RGB photos, no Blue Marble background used.
The japanese JMA website states explicitly that the full disk true color images of the Himawari 8 satellite are real time photos (every 10 minutes) using the satellites RGB channels and 1 infrared channel (to restore some missing green channel range). This are real time color photos of the whole earth, no CGI, no Blue Marble, no simulations.
The Himawari has beside the 3 RGB channels 13 infrared channels (total of 16 channels). Clouds are visible in infrared at night. The night sides on some processed Himawari images are created using the infrared channels. Again, no CGI, no simulation, real infrared photos of the whole earth.
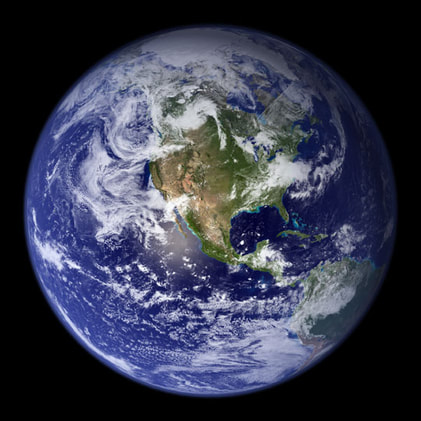
Blue Marble Data Set
Blue Marble
Terra - MODUS pictures of surface.
4 Months Pole to Pole (June-Sept 2001)
10,000 Images
Put together so public would have a beautiful image of Earth to look at.
Composite. Huge files 21,000 pixels.
Clouds Removed and details Added
https://visibleearth.nasa.gov/images/57752/blue-marble-land-surface-shallow-water-and-shaded-topography
Animation of Terra
Blue marble data set is taken from multiple pole orbiting satellites around the globe. This is a bad point to argue.
Blue marble data set is taken from multiple pole orbiting satellites around the globe. This is a bad point to argue.
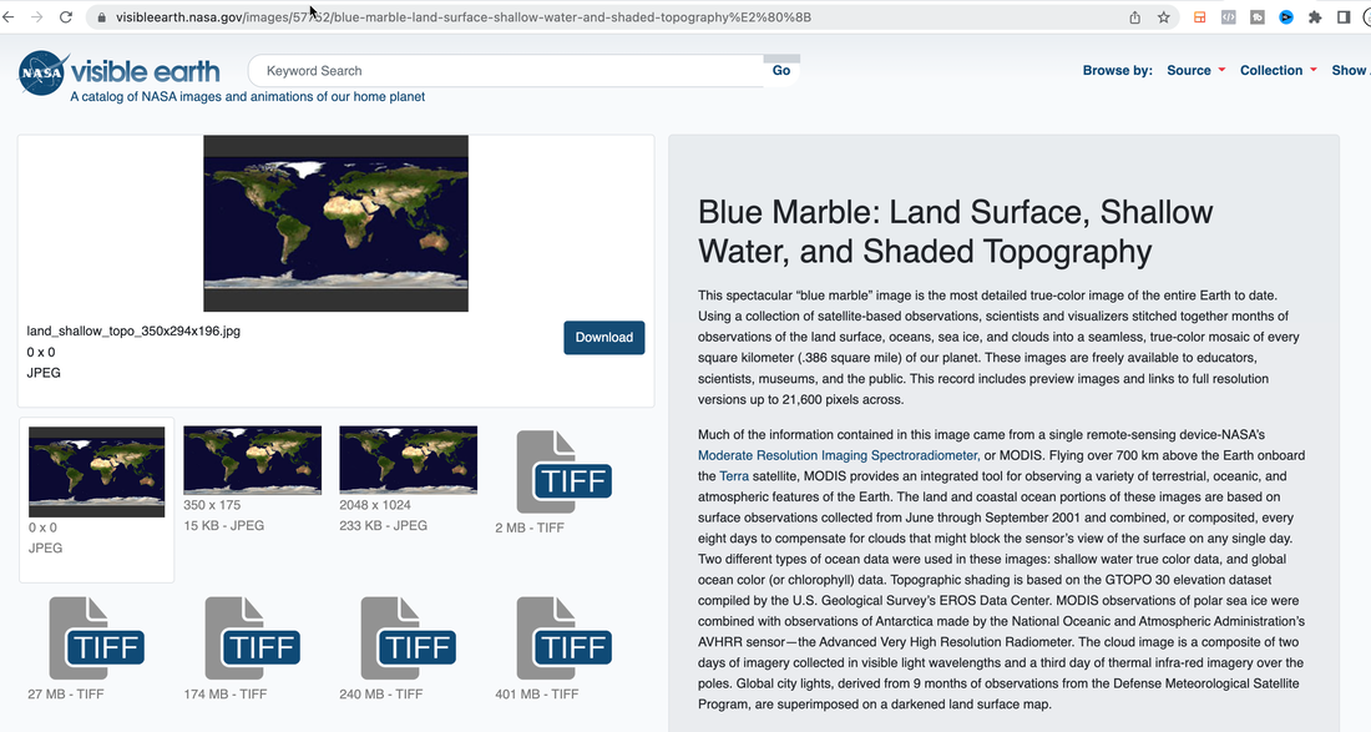
This spectacular “blue marble” image is a detailed true-color image of the entire Earth to date. Using a collection of satellite-based observations, scientists and visualizers stitched together months of observations of the land surface, oceans, sea ice, and clouds into a seamless, true-color mosaic of every square kilometer (.386 square mile) of our planet. These images are freely available to educators, scientists, museums, and the public. Preview images and links to full resolution versions—up to 21,600 pixels across—are located below.
Much of the information contained in this image came from a single remote-sensing device-NASA’s Moderate Resolution Imaging Spectroradiometer, or MODIS. Flying over 700 km above the Earth onboard the Terra satellite.
The land and coastal ocean portions of these images are based on surface observations collected from June through September 2001 and combined, or composited, every eight days to compensate for clouds that might block the sensor’s view of the surface on any single day.
The cloud image is a composite of two days of imagery collected in visible light wavelengths and a third day of thermal infra-red imagery over the poles.

Whole Photoshop thing:
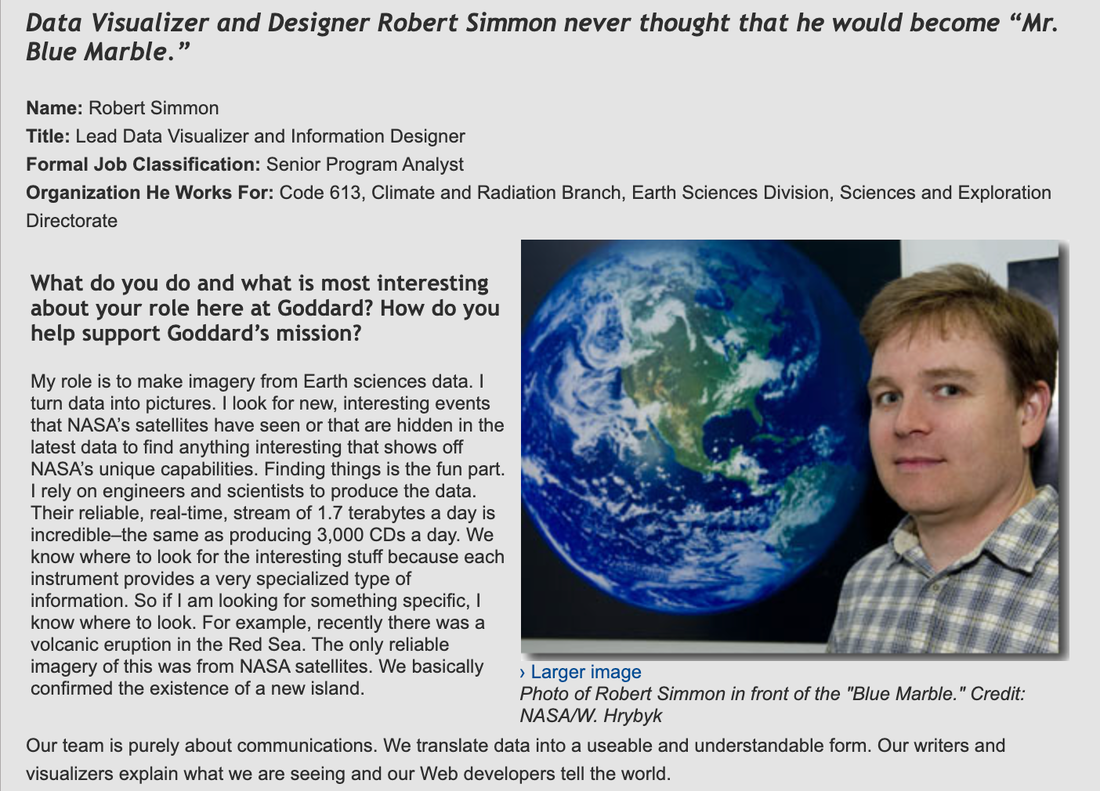
"Blue Marble Data Set is a Flat Script Data Pieced together by an Artist Named Robert Simmons" - PoTP
The author of "Blue Marble" is Robert Simmon, a data analyst and designer at NASA's Earth Observatory. He created "Blue Marble" using data from more than 10,000 images taken by Terra satellite over 4 months. And to make the image look real and clearer, the clouds were removed and some details were added.
Simmons was able to use a series of earth surface data, collected from NASA's Terra satellite in order to construct the final result. Gathering data over the course of 4 months (10,000 images), as the satellite spun around its path, light data could be gathered from pole to pole of the surface below. The hard part was creating a flat map of the Earth’s surface with four months’ of satellite data. Reto Stockli, now at the Swiss Federal Office of Meteorology and Climatology, did much of this work.
Then we digitally composited and wrapped the flat map around the surface of a computer generated sphere yes in photoshop (so what?). My part was integrating the surface, clouds, and oceans to match people’s expectations of how Earth looks from space. That ball became the famous Blue Marble.
Simmon admits that there are fake details in this photo. Specifically, clouds are created using cloud map data, they are distributed evenly and beautifully thanks to the help of the clone tool in Photoshop. The color of sea water is created from data on chlorophyll levels in the ocean and the low altitude of the continent is created from topographic data. After adding new details, the image is completely edited thanks to the 3D rendering software and Photoshop.
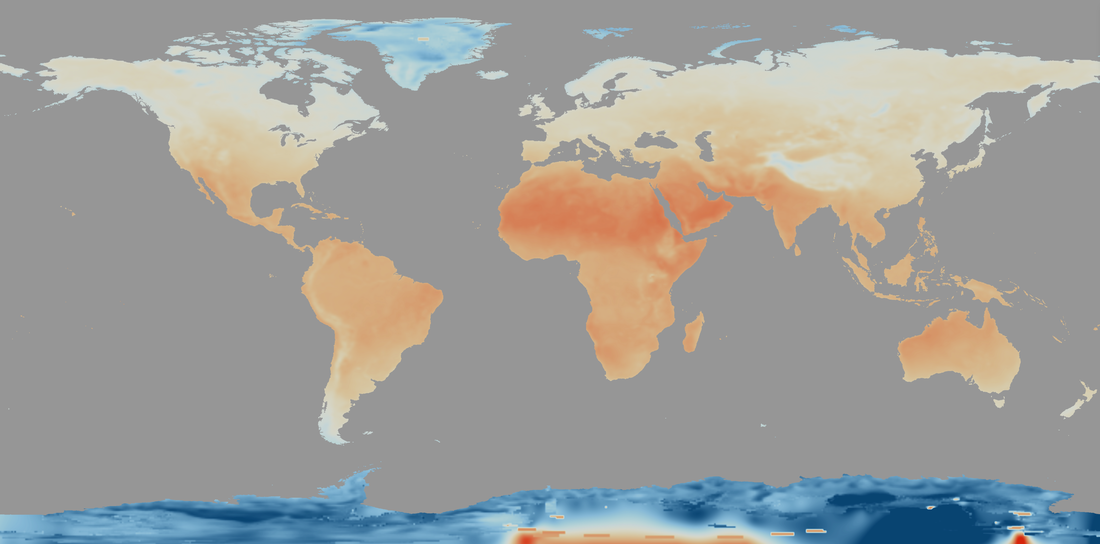
4. Weather Over the Oceans Comes from Software Simulations?
**WRONG** The Is Temperature Forecast Data, nothing to do with Cloud Cover!
**WRONG** The Is Temperature Forecast Data, nothing to do with Cloud Cover!
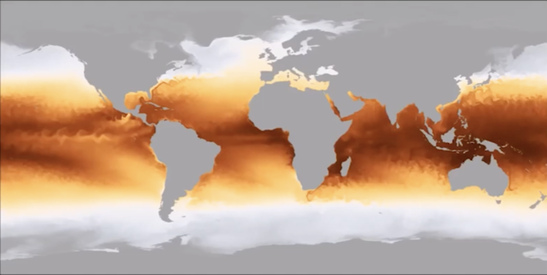
That the cloud images are generated by computer models from weather radar data, as claimed by Paul, is a lie. They are real time infrared photos from the GOES satellites. What Paul references as computer simulations of the future are global temperature predictions. They are not weather predictions. Weather can only be predicted some days in advance using current data from satellites like GOES etc. Cloud formations can not be predicted at all. Clouds are always photos.
Dave seems to think that annual globe temperature simulations somehow translate to daily cloud cover simulations through some means which he does not expand upon.
Dave seems to think that annual globe temperature simulations somehow translate to daily cloud cover simulations through some means which he does not expand upon.
ftp://ftp.nnvl.noaa.gov/
|
|
|
|
5. Weather over the land, Doppler and Supercomputers
**Wrong Again** Can't get cloud cover details from Doppler either.
Complete Composite map wrapped around the ball? *NO*
**Wrong Again** Can't get cloud cover details from Doppler either.
Complete Composite map wrapped around the ball? *NO*
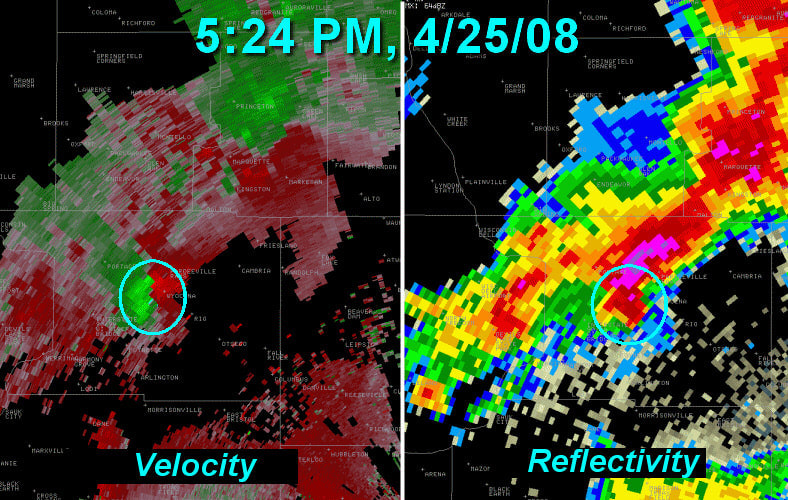
Doppler radar does not show clouds, it only shows rain and pressure changes. It does not show cloud cover.
Cloudy day sometimes and no red or green spots on doppler radar in your area.
So what flat earthers are saying is that someone NOAA takes doppler radar which does not actually see cloud cover and mixing it with global prediction for temperature changes and weather simulation, that are not entirely accurate and they also do not measure cloud cover and put it together and we get global cloud cover??
AI drawing websites.
Well now they are calling those AI drawing websites as proof of how it can work. They then lie saying those come out photorealistic when they don’t.
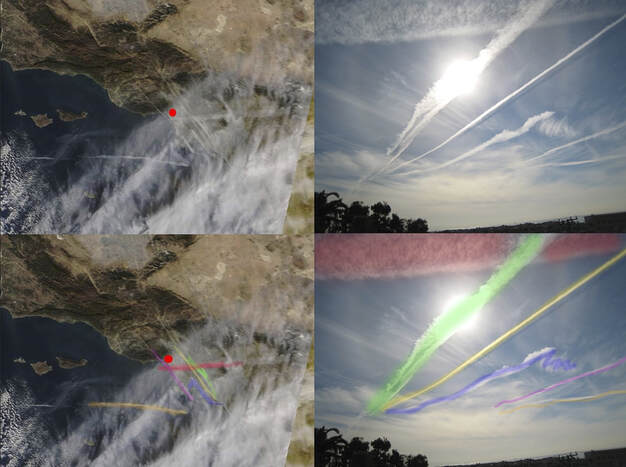
The supposed simulation claim isn't able to account for the things like bush fires and the smoke plumes that are visible both on the Himawari8 and out the window.
Cloudy day sometimes and no red or green spots on doppler radar in your area.
So what flat earthers are saying is that someone NOAA takes doppler radar which does not actually see cloud cover and mixing it with global prediction for temperature changes and weather simulation, that are not entirely accurate and they also do not measure cloud cover and put it together and we get global cloud cover??
AI drawing websites.
Well now they are calling those AI drawing websites as proof of how it can work. They then lie saying those come out photorealistic when they don’t.
The supposed simulation claim isn't able to account for the things like bush fires and the smoke plumes that are visible both on the Himawari8 and out the window.

Doppler Radar .... Nope!
So, the purpose is to detect the wind speed as well as water vapour in the cloud, not imaging of the cloud.
Impossible to use ground based systems to cover the vast oceans?
Weather over oceans software simulations?? Huh?
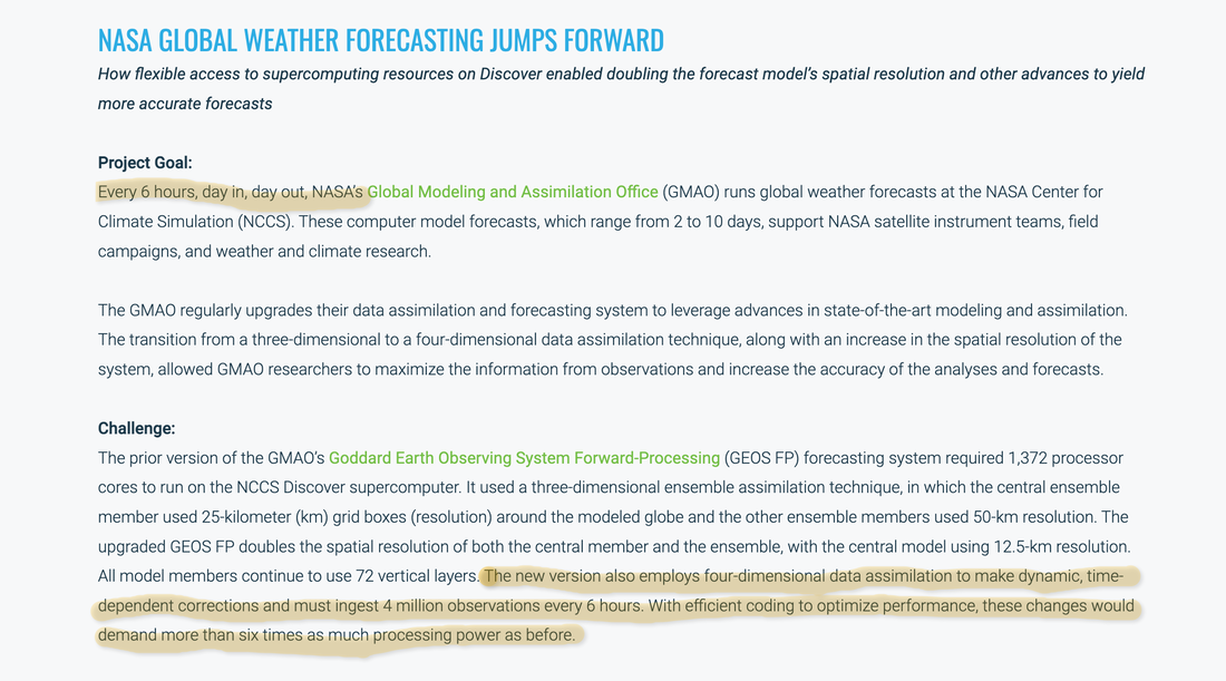
For weather over the land...The NOAA has supercomputers taking data coming
in from over the land from Doppler radar feeds and coming it with weather simulation
software over the oceans to come up with a complete composite doppler map.
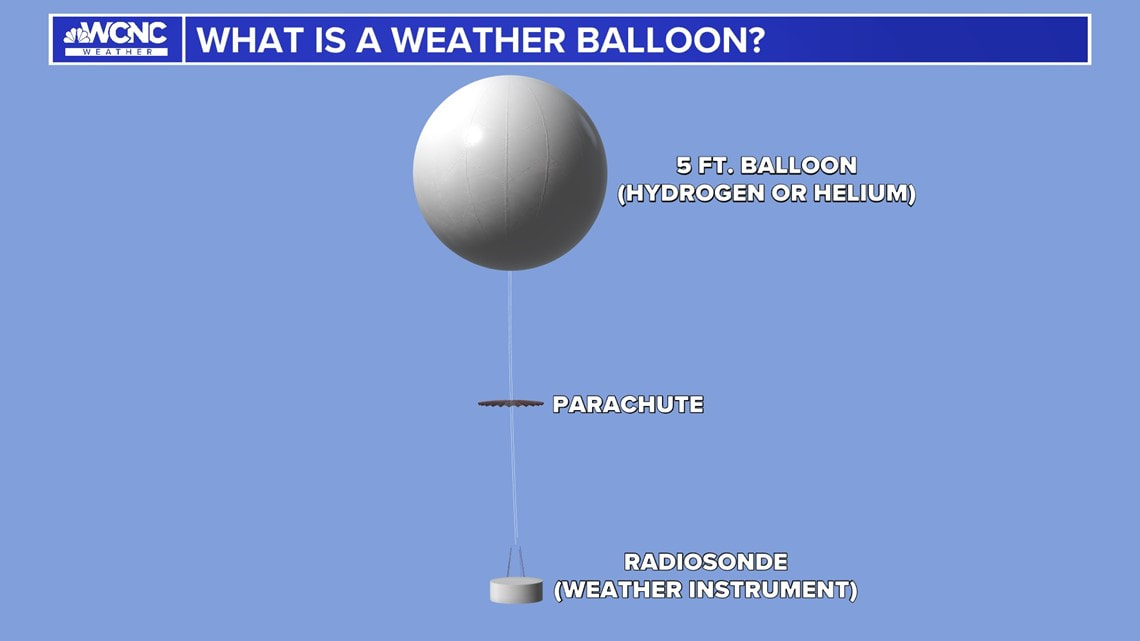
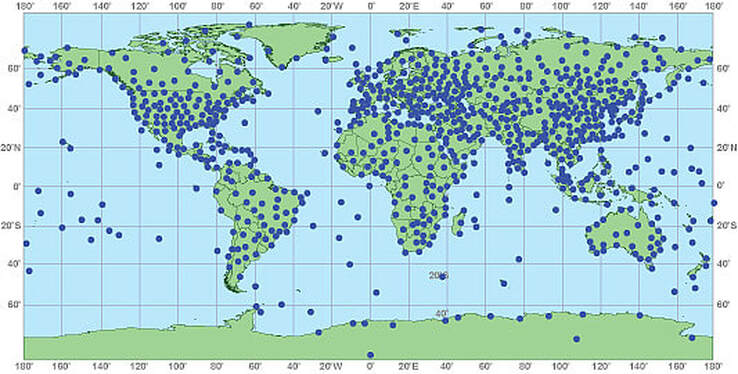
What about weather balloons? NO, they do not cover the whole earth and there is no
way thousands of weather balloons could all communicate to stitch together a full disk images every 10 minutes. Citations PLEASE!!
So, the purpose is to detect the wind speed as well as water vapour in the cloud, not imaging of the cloud.
Impossible to use ground based systems to cover the vast oceans?
Weather over oceans software simulations?? Huh?
For weather over the land...The NOAA has supercomputers taking data coming
in from over the land from Doppler radar feeds and coming it with weather simulation
software over the oceans to come up with a complete composite doppler map.
What about weather balloons? NO, they do not cover the whole earth and there is no
way thousands of weather balloons could all communicate to stitch together a full disk images every 10 minutes. Citations PLEASE!!
|
|
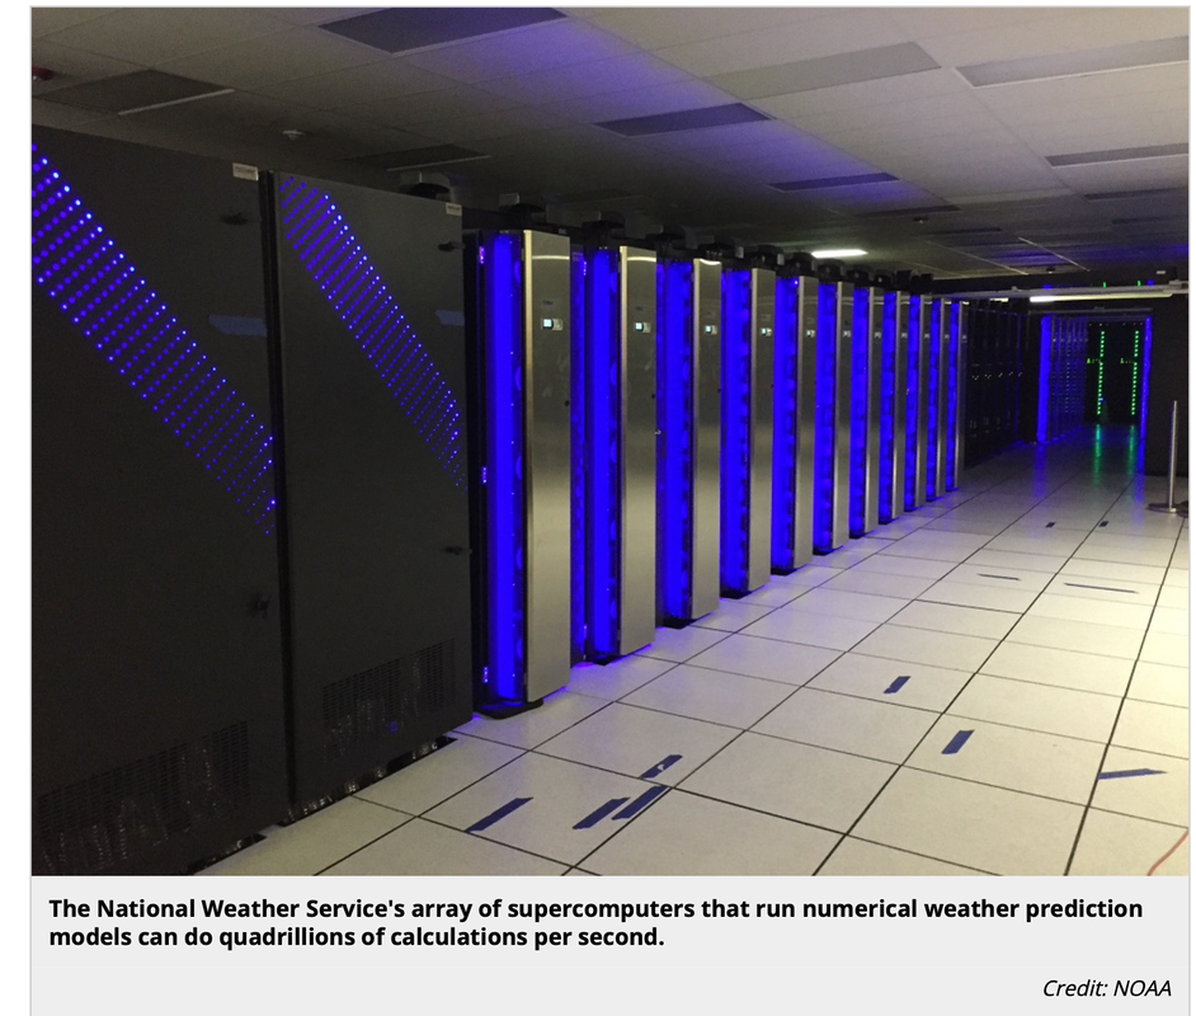
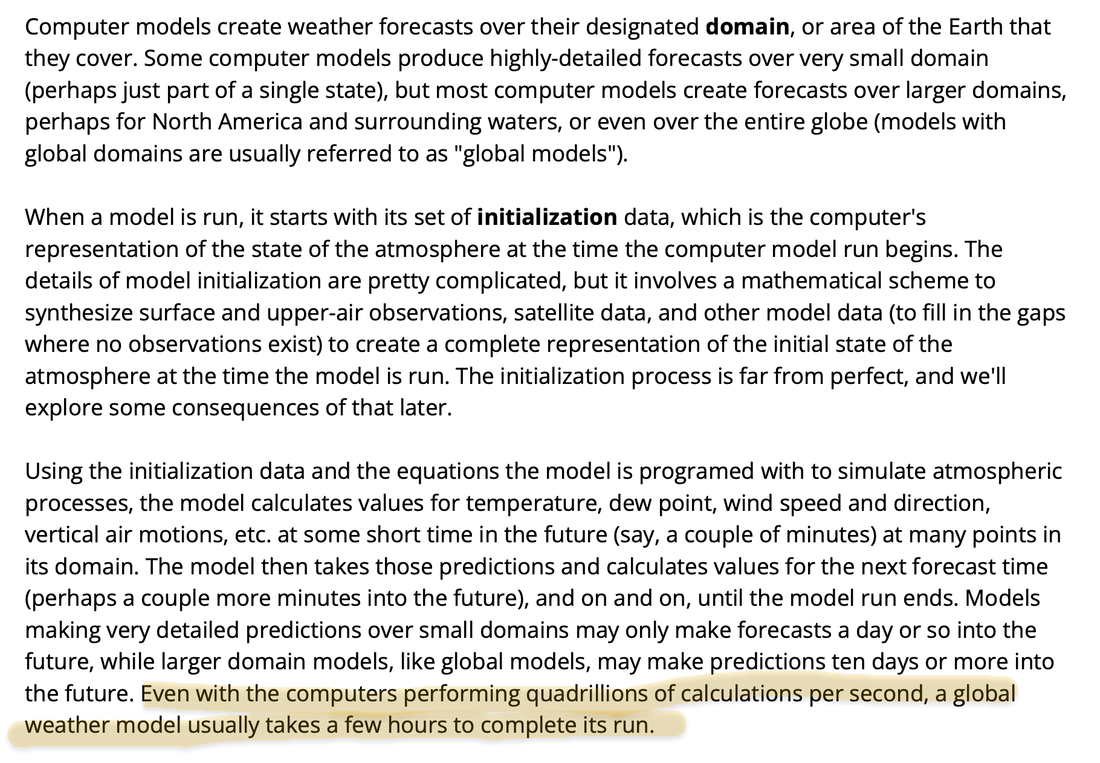
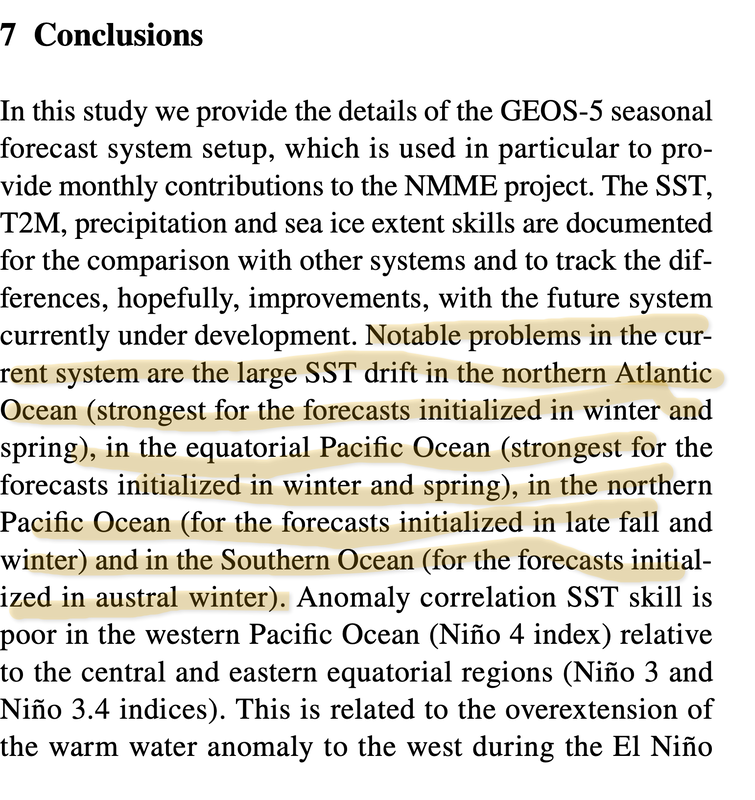
PoTP/GlobeBusters, Pay Attention and Learn How Computer Models Really Work!!
Weather can only be predicted some days in advance using current data from satellites like GOES etc. Cloud formations can not be predicted at all. Clouds are always photos.
Weather can only be predicted some days in advance using current data from satellites like GOES etc. Cloud formations can not be predicted at all. Clouds are always photos.

Compare GOES-5 to Real Time
https://eoimages.gsfc.nasa.gov/images/imagerecords/44000/44246/goes_2010037_lrg.jpg
https://earthobservatory.nasa.gov/images/44246/geos-5-a-high-resolution-global-atmospheric-model
https://eoimages.gsfc.nasa.gov/images/imagerecords/44000/44246/goes_2010037_lrg.jpg
https://earthobservatory.nasa.gov/images/44246/geos-5-a-high-resolution-global-atmospheric-model
|
|
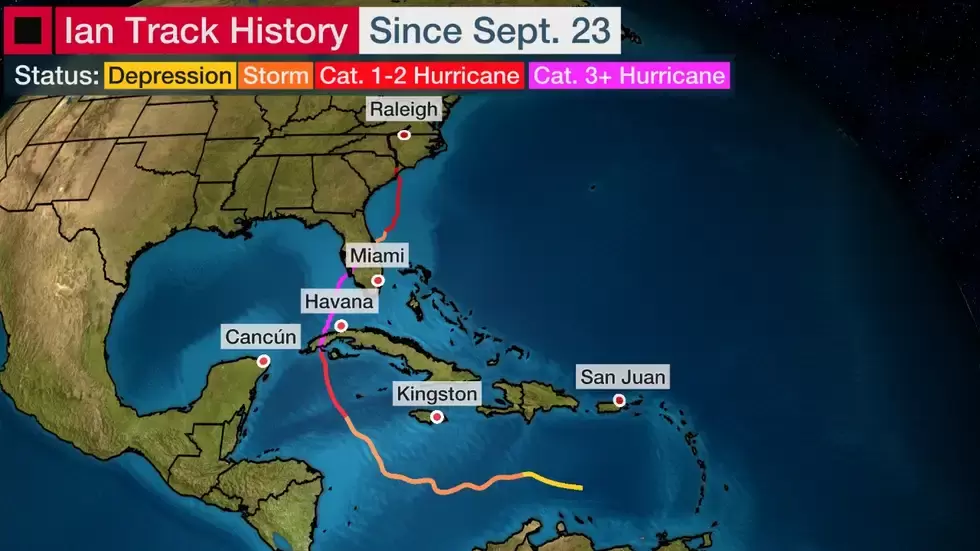
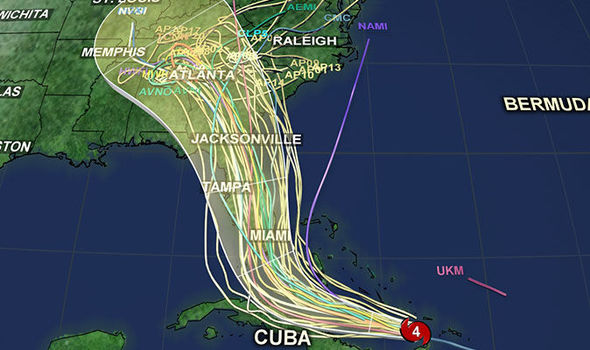
Anyone that thinks Weather Models are Accurate Have never been through a Hurricane!
They cannot even predict the path let alone the precise Cloud Details... Come on, how can you believe this nonsense!
They cannot even predict the path let alone the precise Cloud Details... Come on, how can you believe this nonsense!
|
|
|
|
|
|
|
These observations ultimately led him to formulate what became known as the butterfly effect--a term that grew out of an academic paper he presented in 1972 entitled: "Predictability: Does the Flap of a Butterfly's Wings in Brazil Set Off a Tornado in Texas?"The Butterfly Effect (Butterfly Biology)
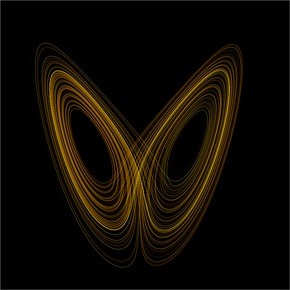
When a butterfly flutters its wings in one part of the world, it can eventually cause a hurricane in another. - Edward Lorenz Chaos Theory (Mathematician and Meterologist). In chaos theory, the butterfly effect is the sensitive dependence on initial conditions in which a small change in one state of a system can result in large differences in a later state. In the early 1960s, Lorenz realized that small differences in a dynamic system such as the atmosphere--or a model of the atmosphere--could trigger vast and often unsuspected results. |
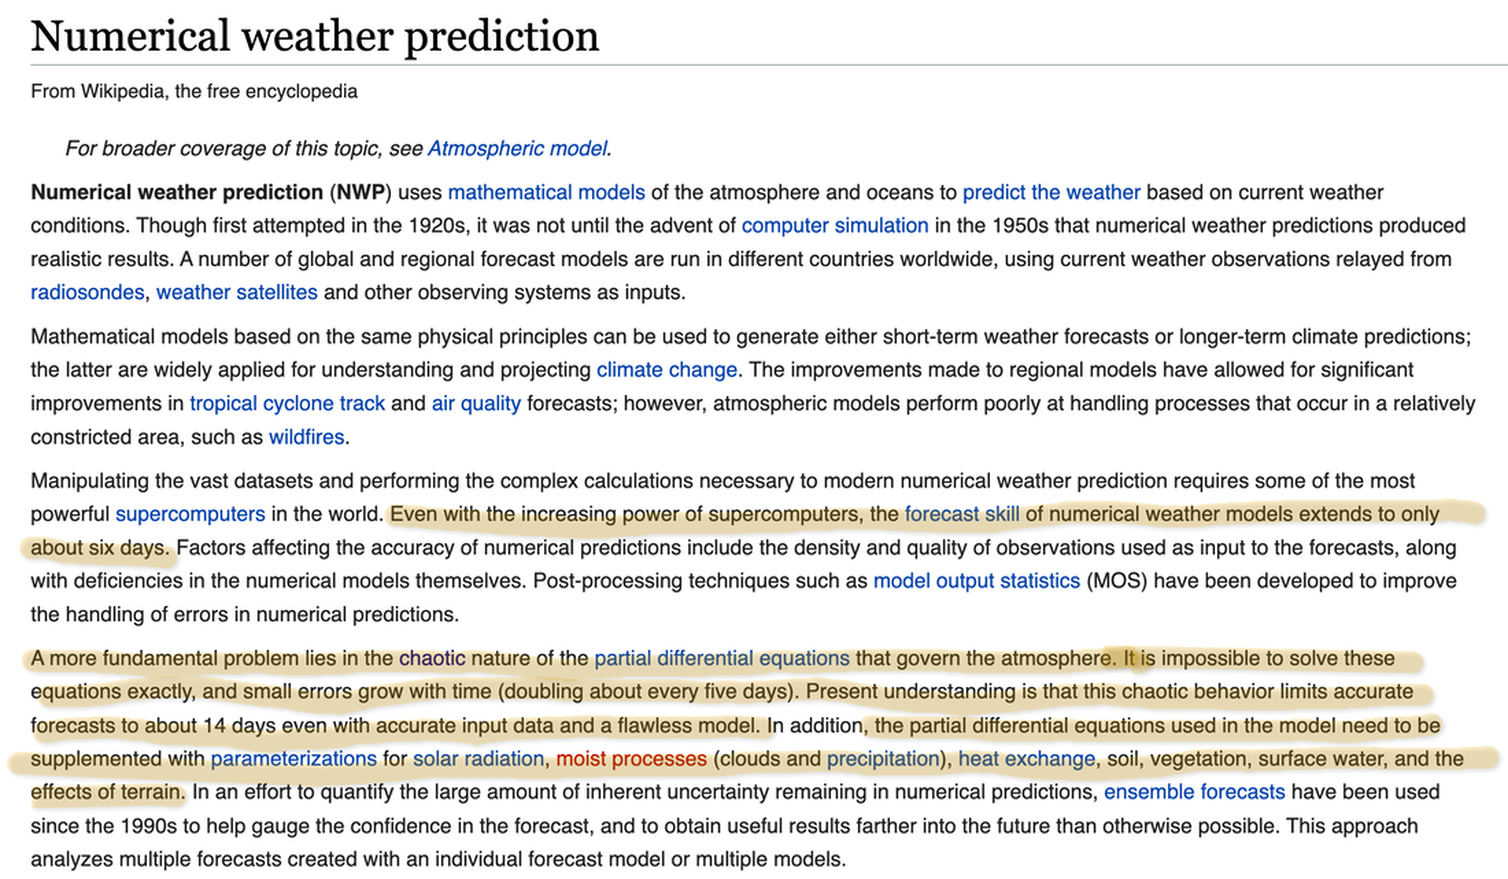
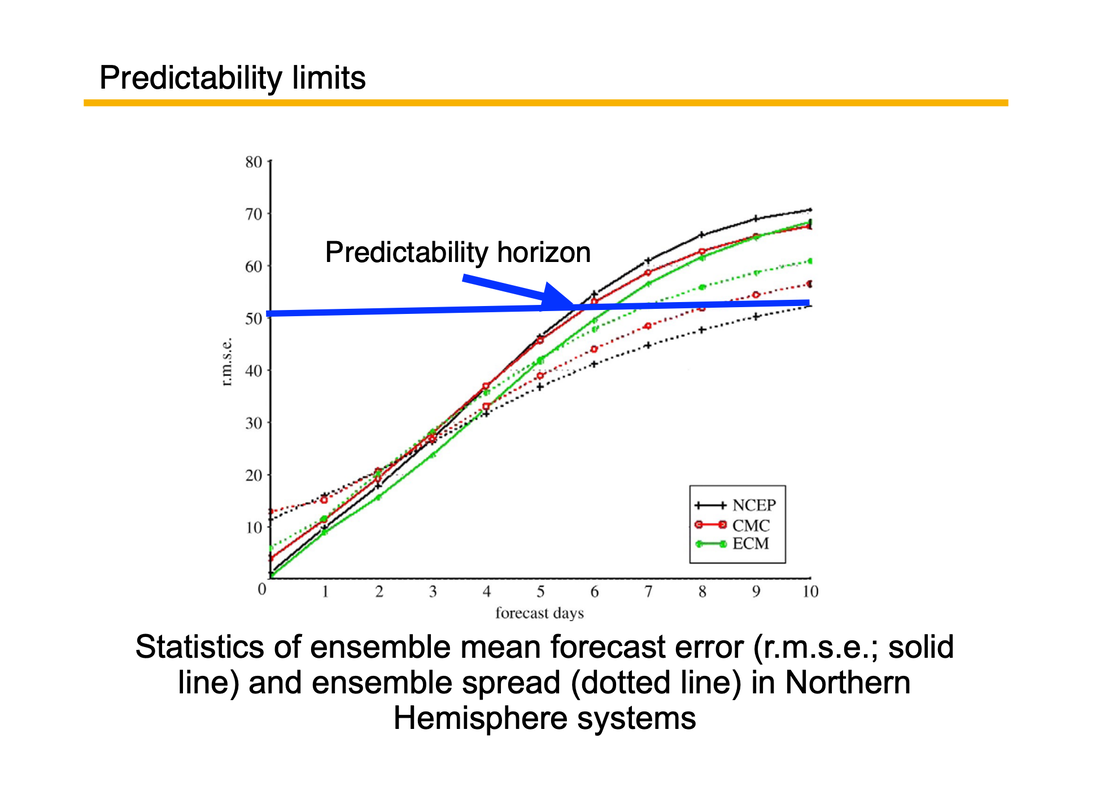
Lorenz's early insights marked the beginning of a new field of study that impacted not just the field of mathematics but virtually every branch of science--biological, physical and social. In meteorology, it led to the conclusion that it may be fundamentally impossible to predict weather beyond two weeks with a reasonable degree of accuracy.
|
|
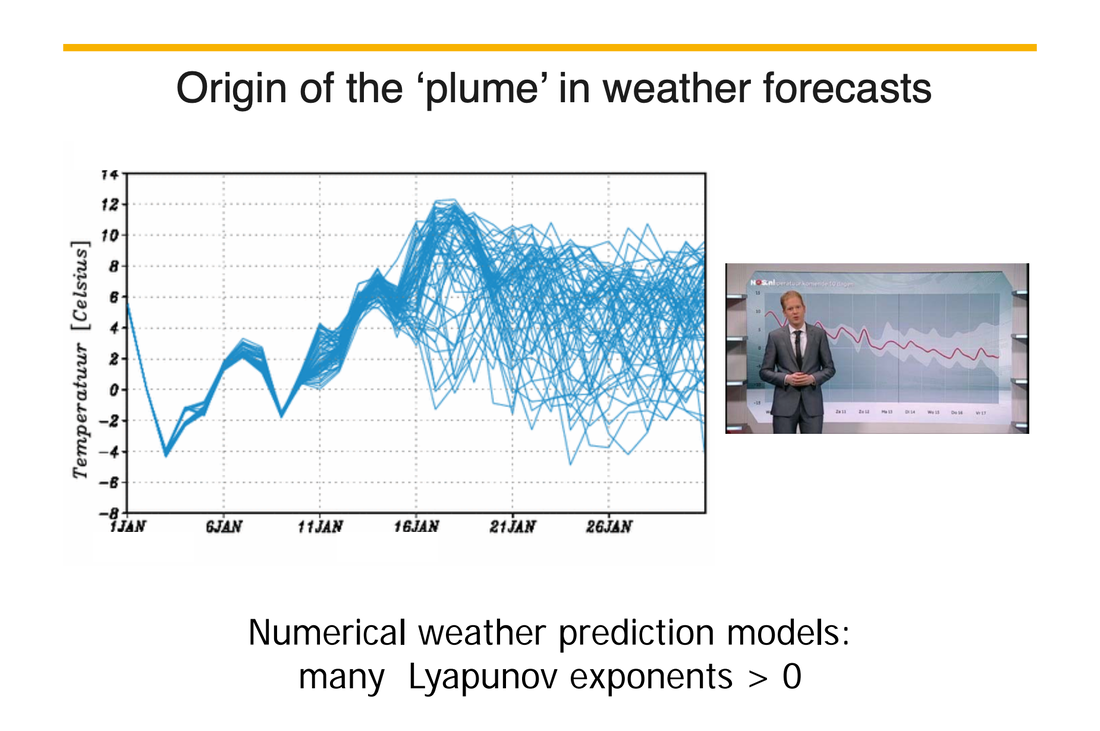
Chaos plays a very different role in uncertainties of
weather forecasts and climate projections Future weather forecasts: - relevant processes are instabilities of the large-scale atmospheric circulation with typical time scales of up to 5 days - limited prediction skill beyond 10 days Future climate change: - relevant processes are several large-scale feedbacks in the climate system associated with the radiation balance - projection skill is limited by emission scenario Creative aspect: Phase Space; connecting geometry and motion Creative aspects: Sensitivity to initial conditions; Ensemble forecasting Creative aspect: Predictability horizons connected to specific physical processes |
*Lyapunov Exponent*
On predicting planetary orbits Lee-op-uh-noff Exponent and Time - Horizon of predictability https://www.uu.nl/sites/default/files/lecture_predictability2.pdf 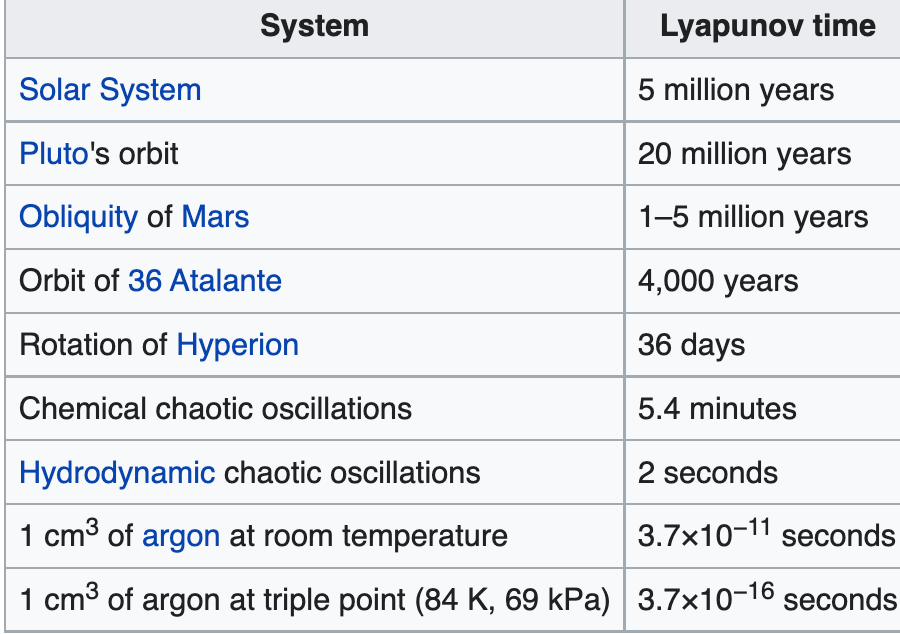
|
|
|
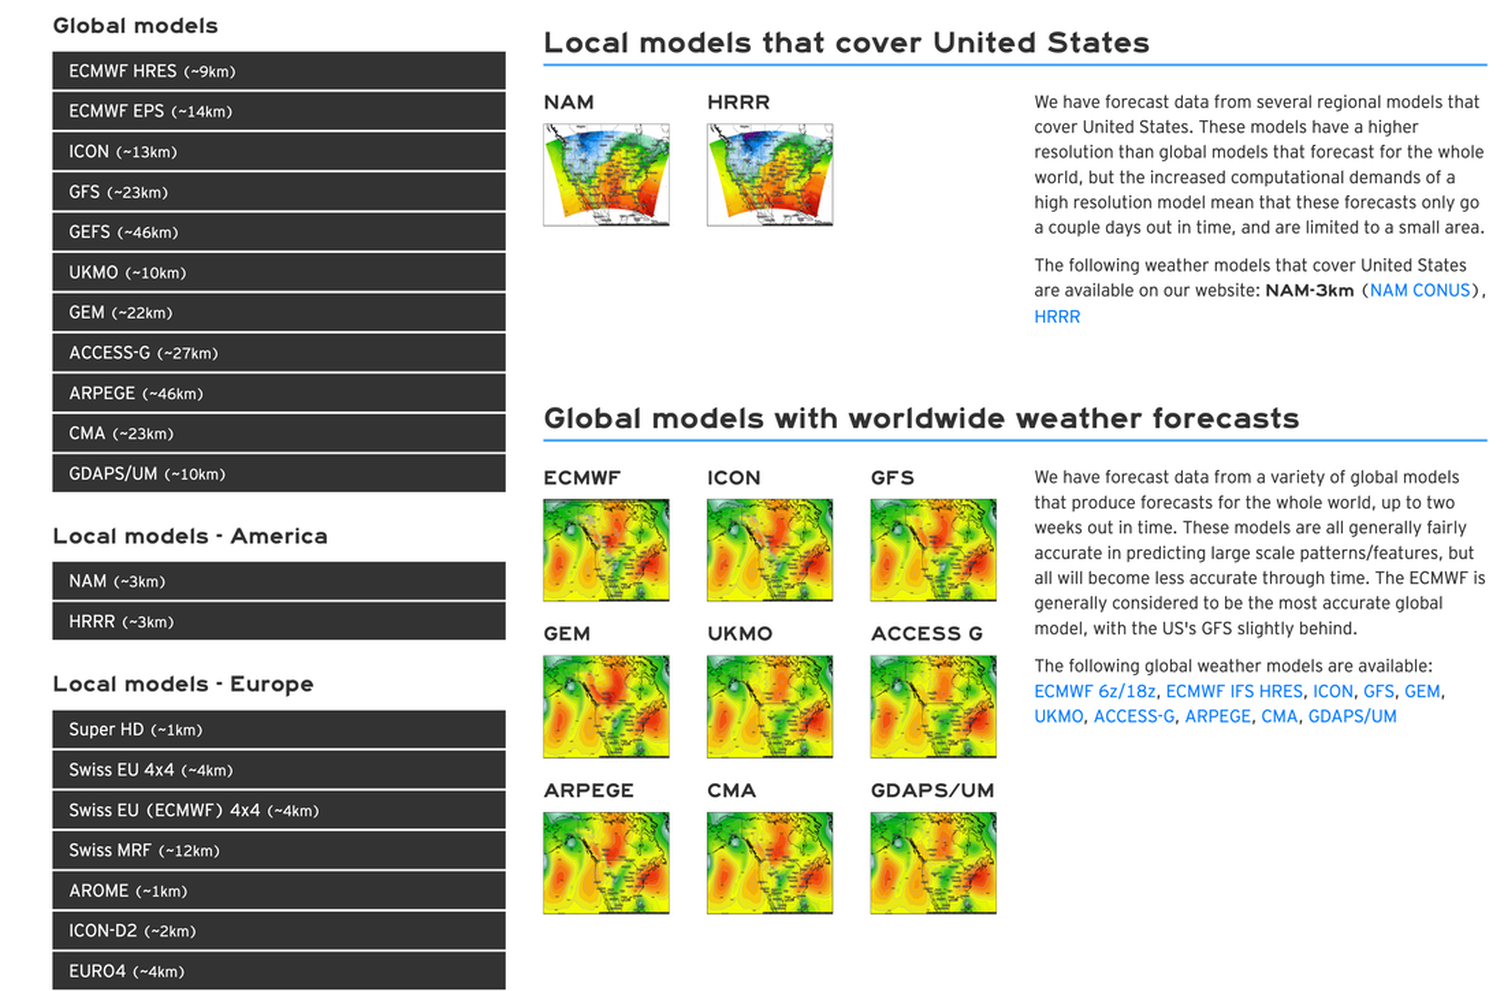
https://weather.us/model-charts
Putting It All Together!
4. Weather Over the Oceans Comes from Software Simulations?
**WRONG** The Is Temperature Forecast Data, nothing to do with Cloud Cover!
4. Weather Over the Oceans Comes from Software Simulations?
**WRONG** The Is Temperature Forecast Data, nothing to do with Cloud Cover!
5. Weather over the land, Doppler and Supercomputers
**Wrong Again** Can't get cloud cover details from Doppler either.
Complete Composite map wrapped around the ball? *NO*
**Wrong Again** Can't get cloud cover details from Doppler either.
Complete Composite map wrapped around the ball? *NO*
Air Mass imagery via the Himawari-8 satellite,
which shows temperature and moisture characteristics of air masses.
Learn more about how to interpret this type of imagery: bit.ly/3a8KxY3
It is not simply a photo. It is several photos in different wavelengths calibrated to detect different things.
The objective of the Himawari mission is not to prove that the earth is round, but to detect weather phenomena, smoke, &c.
|
|
FTP Server Down
As RGB composite imagery
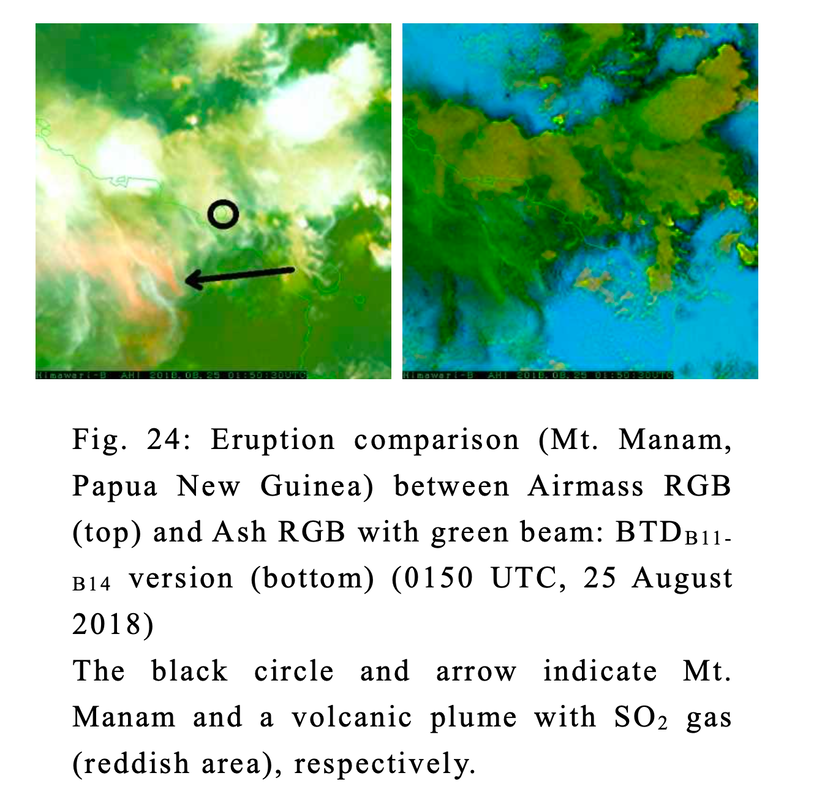
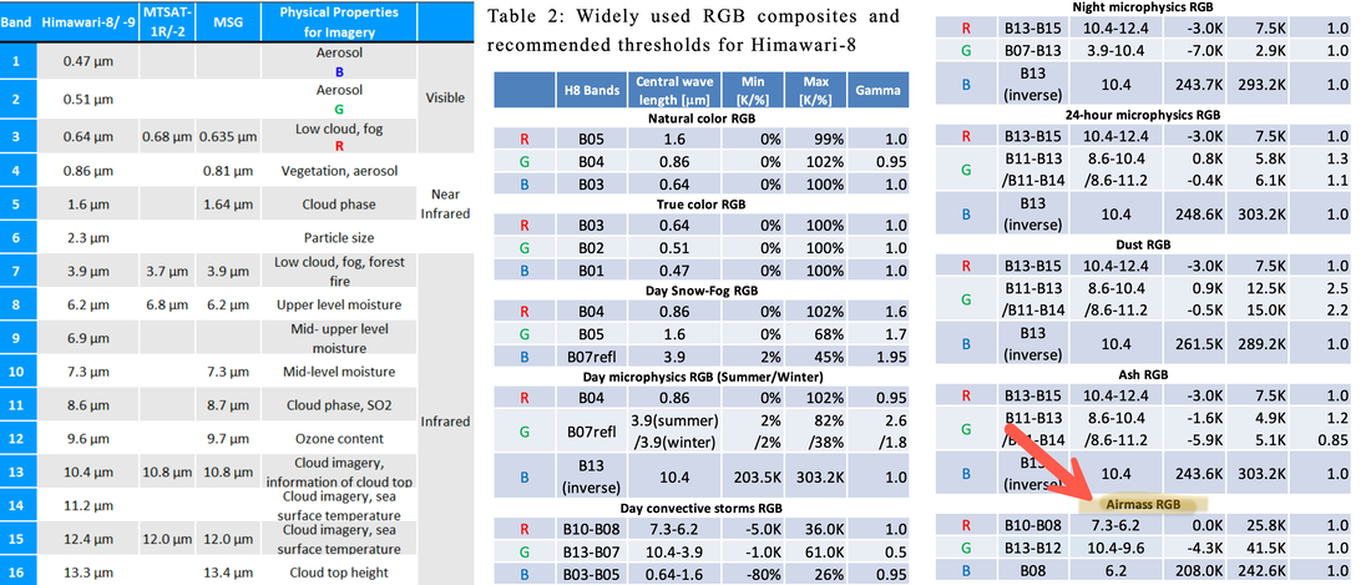
This report outlines a red/green/blue (RGB) composite technique allowing effective analysis based on color shading to reflect various characteristics in Himawari-8 imagery, with coverage including widely used RGBs, LEO RGBs and new RGBs. Standard RGBs based on MSG RGB recipes (such as Night Microphysics RGB and Dust RGB) are helpful to Himawari-8 imagery users, and other RGBs (such as Natural Fire Color RGB and SO2 RGB) are also applicable to specific purposes. As related thresholds and color interpretations are still being examined, further research is necessary.
As RGB composite imagery is a qualitative product, its use in combination with quantitative products (e.g., satellite-derived content) is recommended (WMO, 2012).

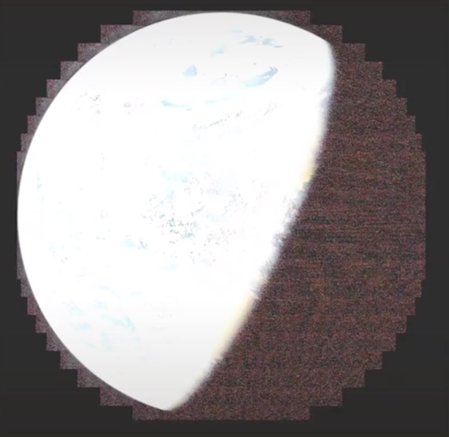
Airmass Terminator Comparison - Do we need?
True Color Images and RGB Composite Imagery
True Color Images and RGB Composite Imagery
Terminator Line
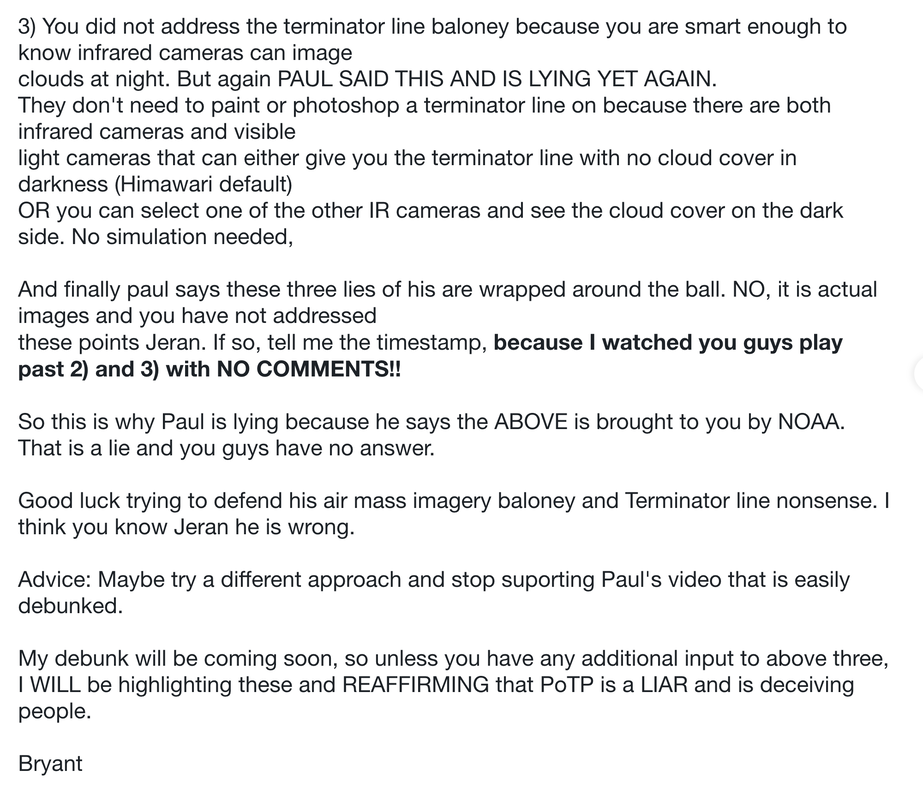
Imaging Clouds at night
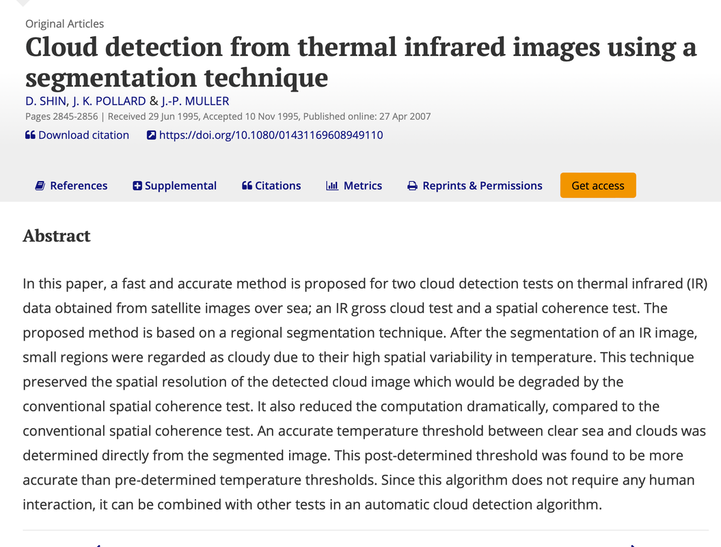
Re: how to detect clouds at night using remote sensing imagery, please see "D. SHIN, J. K. POLLARD & J.-P. MULLER (1996) Cloud detection from thermal infrared images using a segmentation technique, International Journal of Remote Sensing, 17:14, 2845-2856"
https://www.tandfonline.com/doi/abs/10.1080/01431169608949110
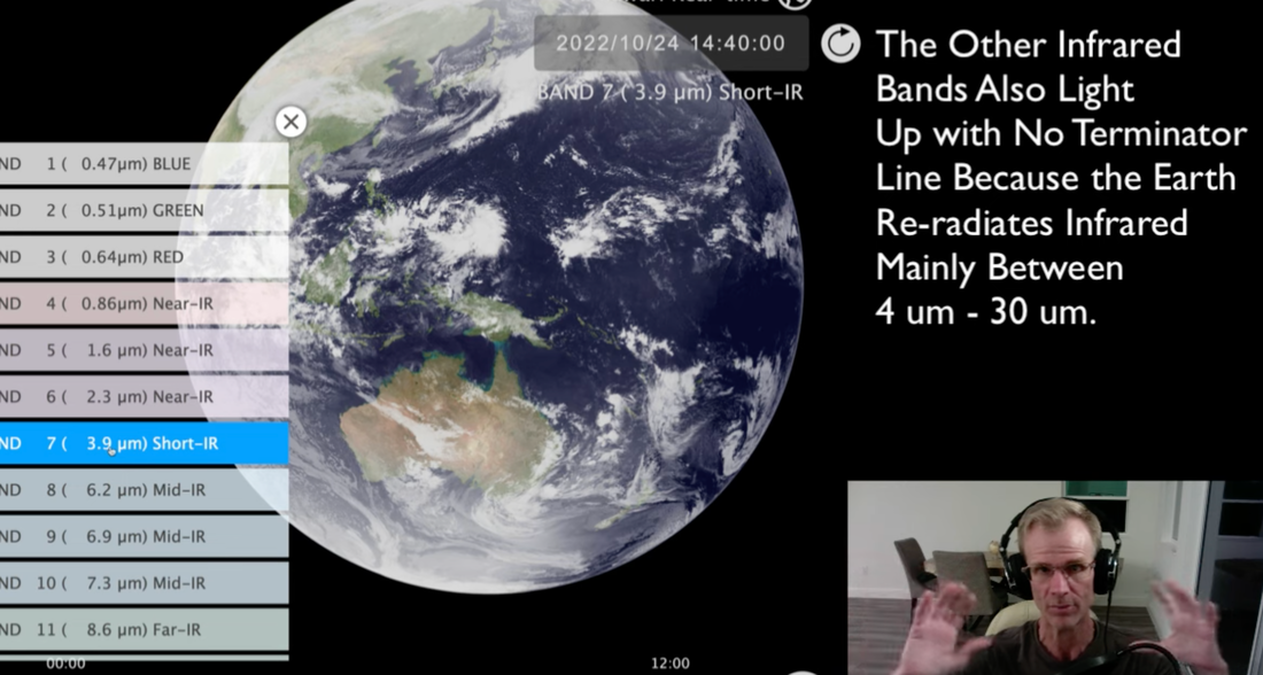
Dave is not realizing Himawari is taking 16 different images, one of which is infrared for nighttime.
There is a terminator line in the visible spectrum but not in the IR (so cloud cover can be seen at night)!
The night time clouds are so easy, they use IR images. This is so basic and been done for years.
So the clouds shapes come from the satellite and then go to the computers for modelling and recording for future reference.
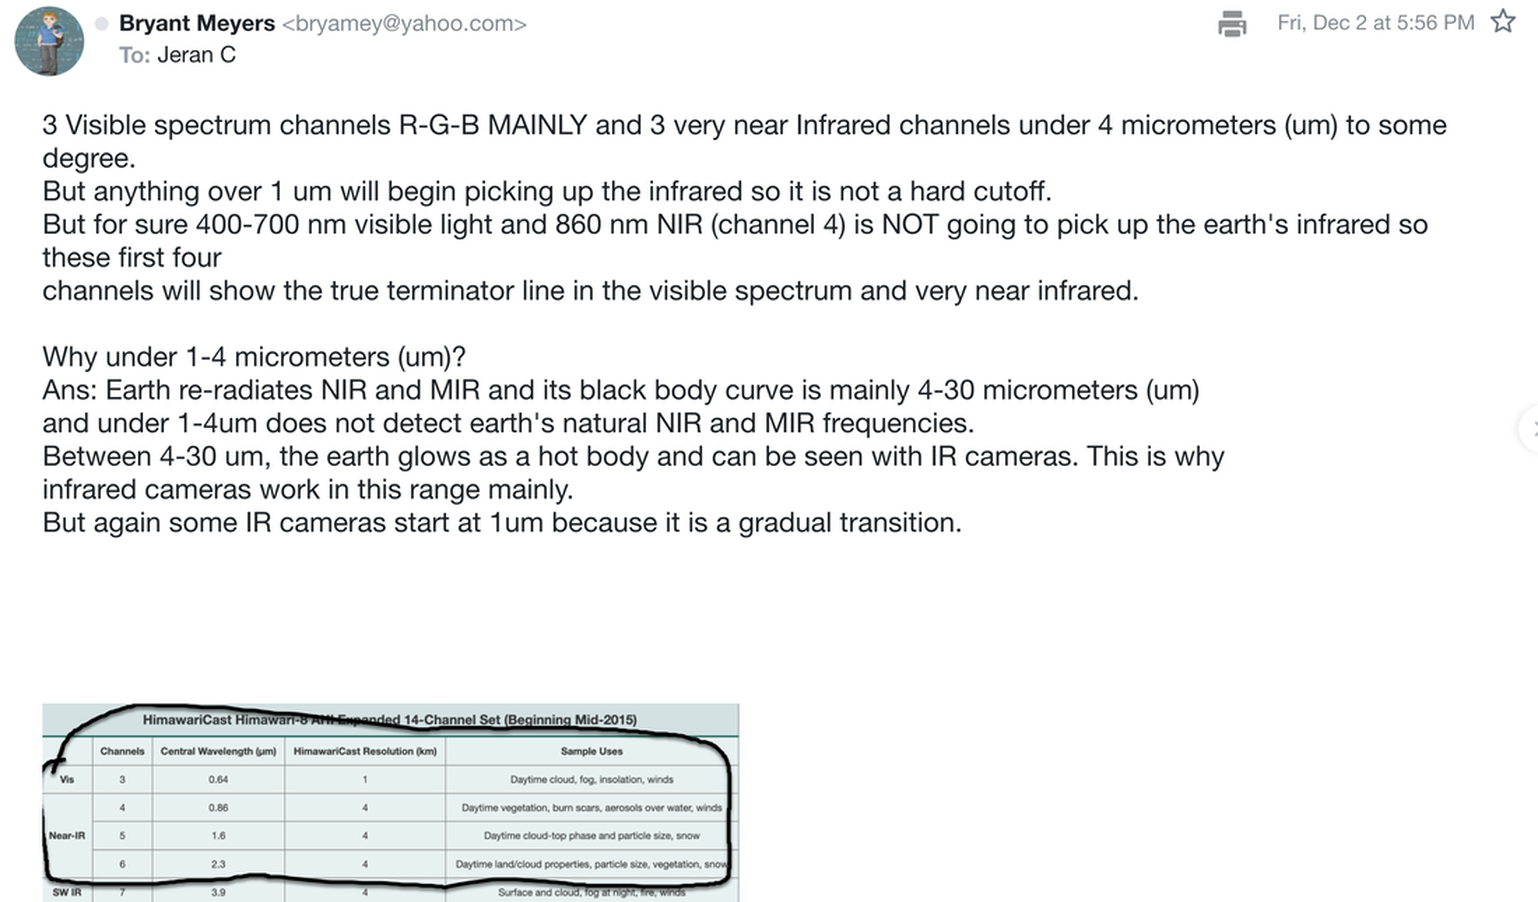
Earth Re-radiates 4-30 uM /SHOW HIMAWARI SITE!!!
https://www.data.jma.go.jp/mscweb/en/himawari89/space_segment/hsd_sample/HS_D_users_guide_en_v12.pdf
Re: how to detect clouds at night using remote sensing imagery, please see "D. SHIN, J. K. POLLARD & J.-P. MULLER (1996) Cloud detection from thermal infrared images using a segmentation technique, International Journal of Remote Sensing, 17:14, 2845-2856"
https://www.tandfonline.com/doi/abs/10.1080/01431169608949110
Dave is not realizing Himawari is taking 16 different images, one of which is infrared for nighttime.
There is a terminator line in the visible spectrum but not in the IR (so cloud cover can be seen at night)!
The night time clouds are so easy, they use IR images. This is so basic and been done for years.
So the clouds shapes come from the satellite and then go to the computers for modelling and recording for future reference.
Earth Re-radiates 4-30 uM /SHOW HIMAWARI SITE!!!
https://www.data.jma.go.jp/mscweb/en/himawari89/space_segment/hsd_sample/HS_D_users_guide_en_v12.pdf
Cloud Data/ Terminator Line
**Stars in background**
Or ask them to take a properly exposed photo of the Moon with stars in the same frame.
Or ask them to take a properly exposed photo of the Moon with stars in the same frame.
|

|
We not only receive the images of earth from many satellites, we can also see the satellites in space from earth on long exposure photos and timelapse videos. We can even see the satellites moving into earths shadow on timelapse videos. We can triangulate the positions of the geostationary satellites. They appear at the same exact location for years and are definitively not in the atmosphere, so no balloons. I could give you links to youtube videos showing all this. But you will call "fake" anyway.
|
|
You can download Himawari and GOES satellite data with your own dish!
Something else that makes them run for the hills is telling them that with a laptop and antenna you can download directly from the satellite. Lots of online tutorials showing you how.
Something else that makes them run for the hills is telling them that with a laptop and antenna you can download directly from the satellite. Lots of online tutorials showing you how.
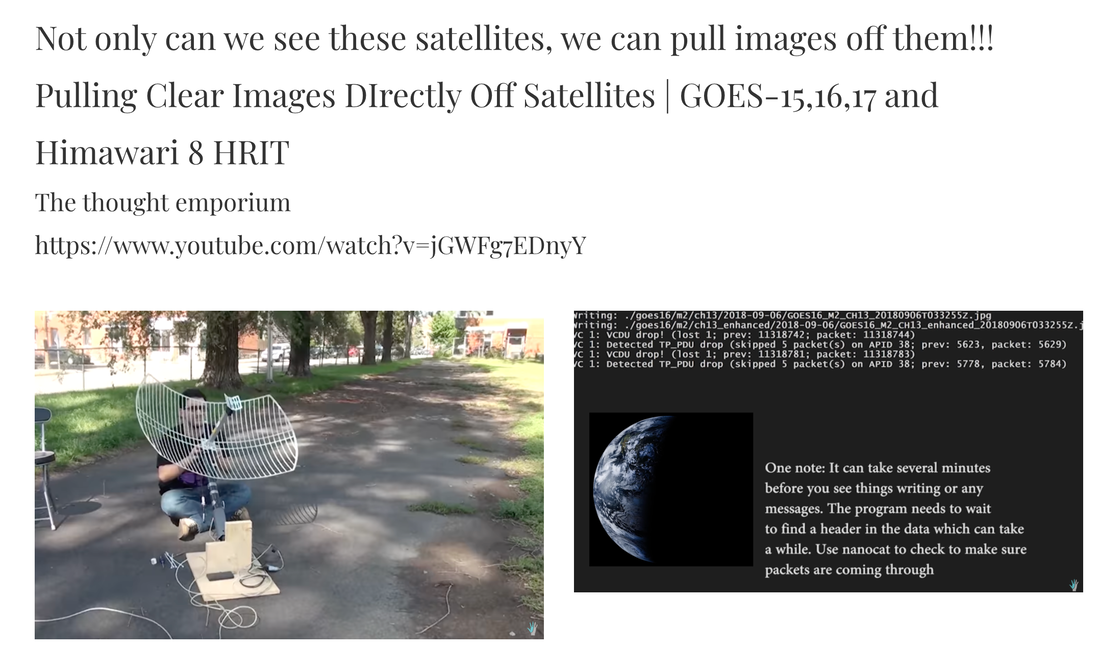
Not only can we see these satellites, we can pull images off them!!!
Pulling Clear Images DIrectly Off Satellites | GOES-15,16,17 and Himawari 8 HRIT
The thought emporium
https://www.youtube.com/watch?v=jGWFg7EDnyY
Pulling Clear Images DIrectly Off Satellites | GOES-15,16,17 and Himawari 8 HRIT
The thought emporium
https://www.youtube.com/watch?v=jGWFg7EDnyY
|
|
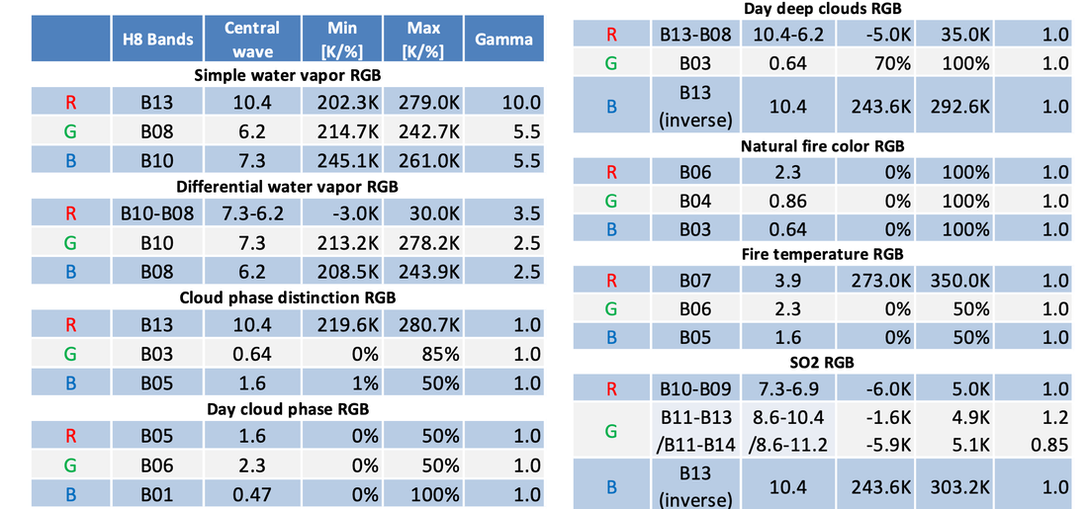
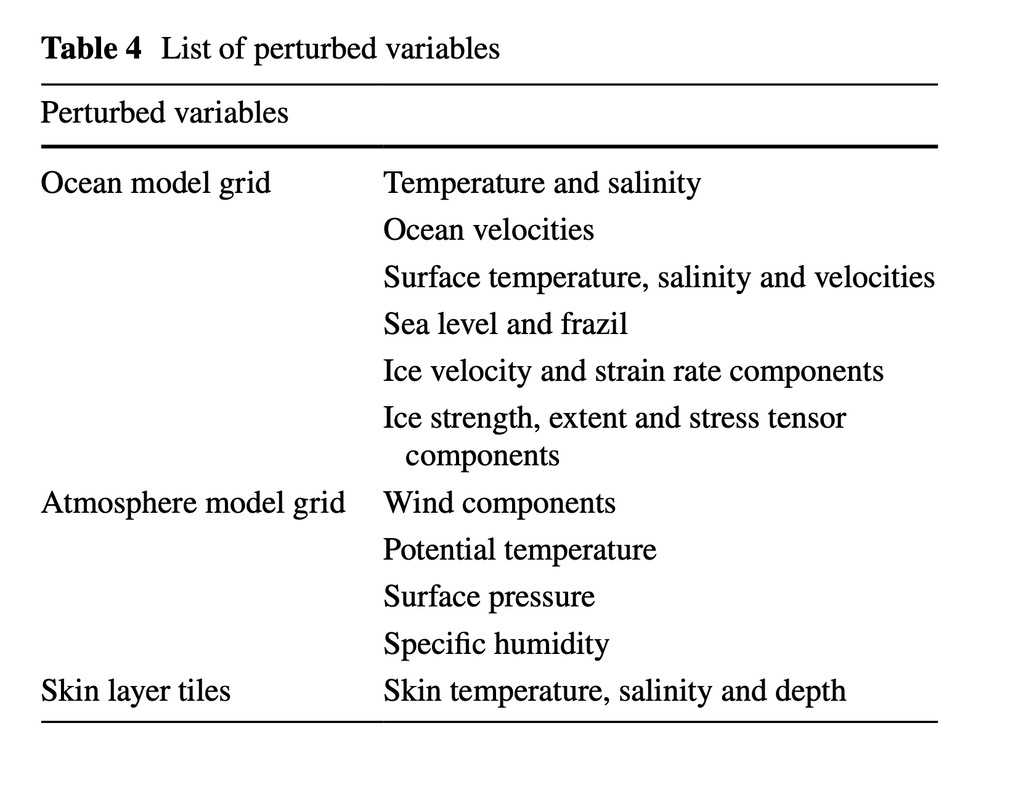
**Bands**
All these bands and their widths are chosen very deliberately, and the way two or more interact on specific topics is amazing. For instance, the NIR bands can be used to identify the health of agricultural crops and nutrient deficiencies (used much closer to home, using drones)
All these bands and their widths are chosen very deliberately, and the way two or more interact on specific topics is amazing. For instance, the NIR bands can be used to identify the health of agricultural crops and nutrient deficiencies (used much closer to home, using drones)
|
|
|
|
**New** The Tonga Volcano
The Tonga volcano also proved the images were real. Tonga was offline for weeks yet we had images of the eruption and the aftermath right away. One flerf insisted it was all from ground stations, which magically worked when the entire island was offline. I think Elon also donated some Starlink to help them communicate right after the eruption. |
NEW **North Korea**
Every once in a while I try to ask them what they think where Google, Bing, etc. got aerial images of North Korea from.
The country is well covered on these services (although sometimes ground features are hidden below clouds). Yet given the political situation I would be very surprised to learn that either NK government is publishing aerial images taken by plane to the world, or had accepted foreign nations flying over their territory to take such pictures from airplanes. Some US services may have such images, taken using U2 planes, but I would surprised by them sharing such imagery with the world, too. These being satellite images is the only thing that makes sense.
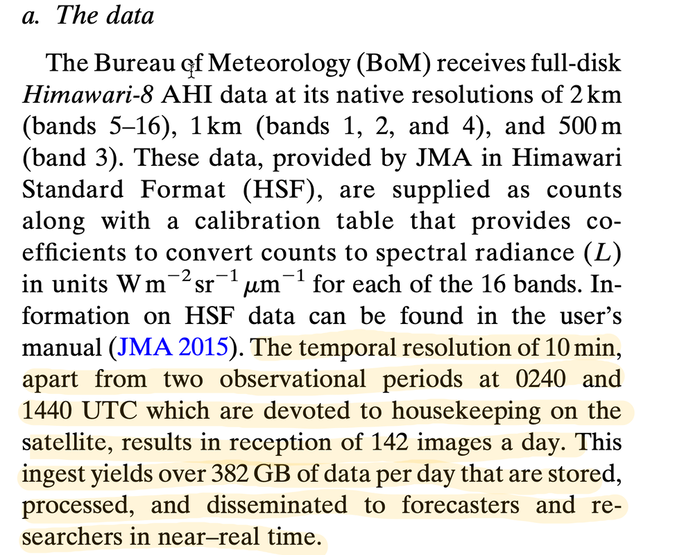
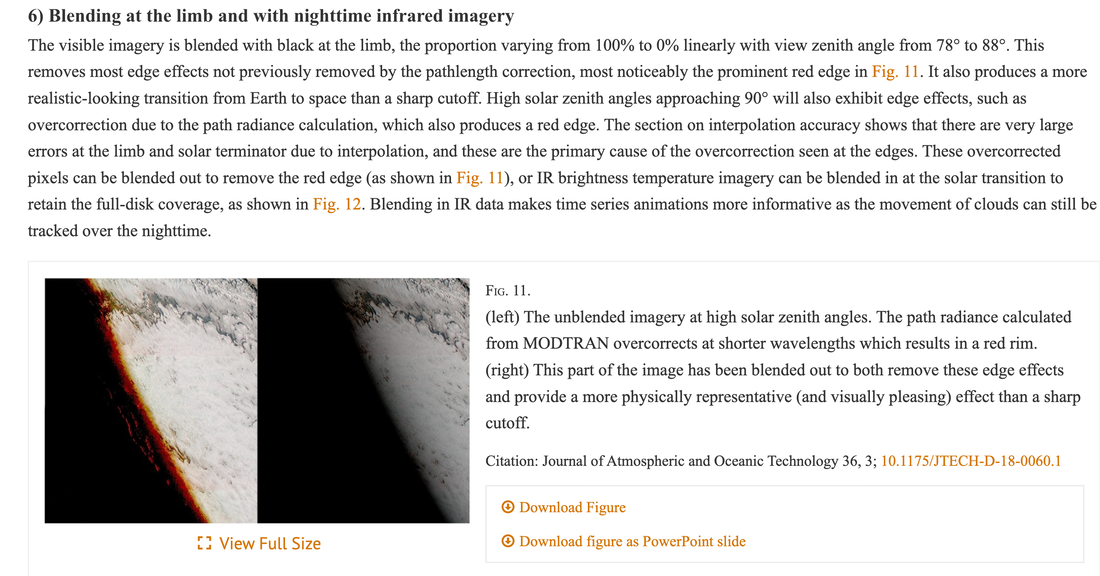
https://journals.ametsoc.org/view/journals/atot/36/3/jtech-d-18-0060.1.xml
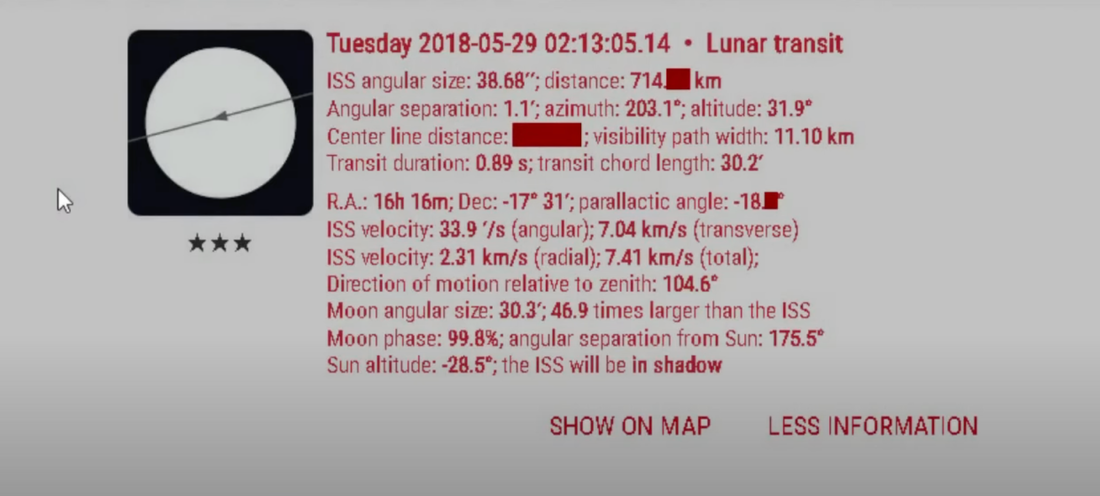
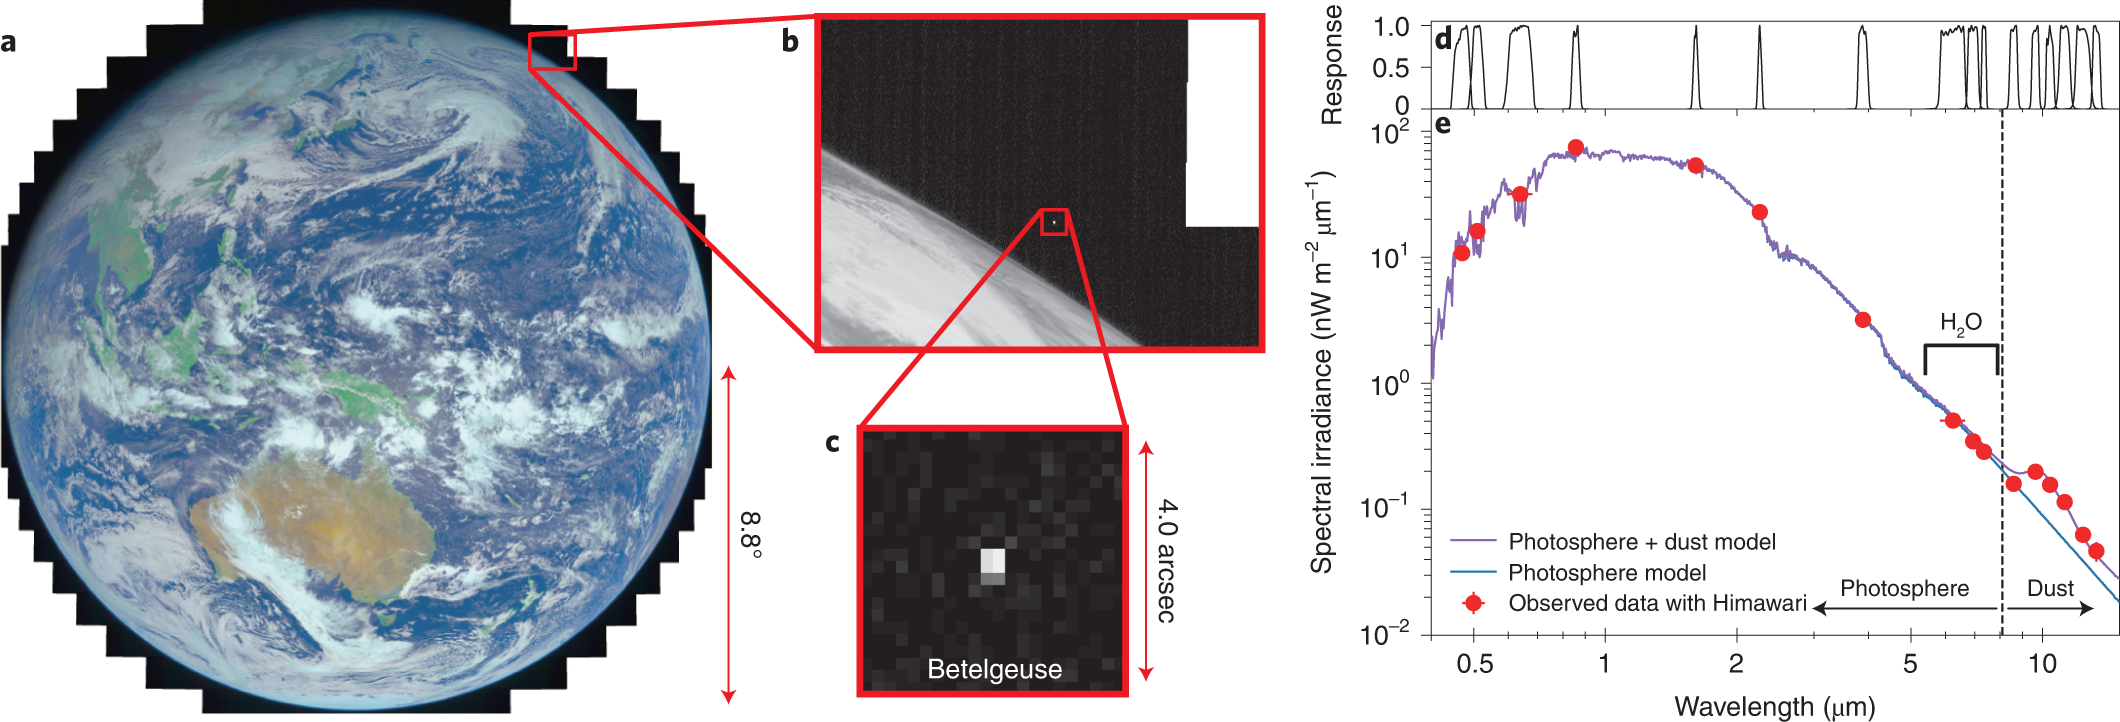
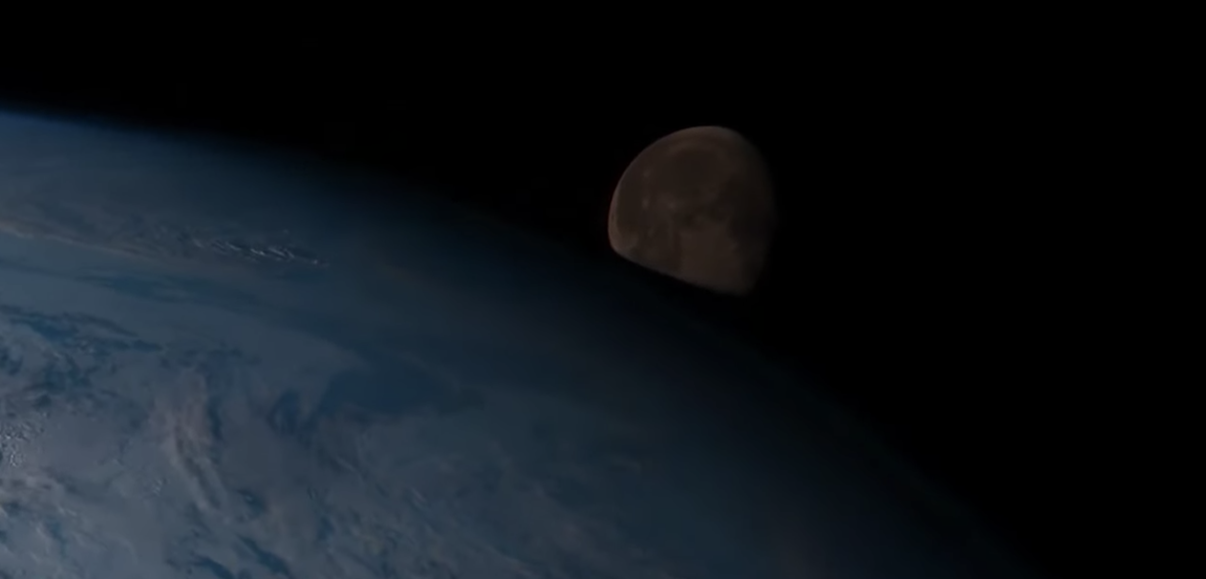
Some Flat Earthers like Jeran Complain the Himawari 8 and others doesn't see the moon. They are WRONG.
The moon is ONLY seen very close to the earth because of the way the Himawari 8 sweeps and scans the earth.
The moon is ONLY seen very close to the earth because of the way the Himawari 8 sweeps and scans the earth.
https://www.data.jma.go.jp/mscweb/en/himawari89/space_segment/spsg_ahi.html
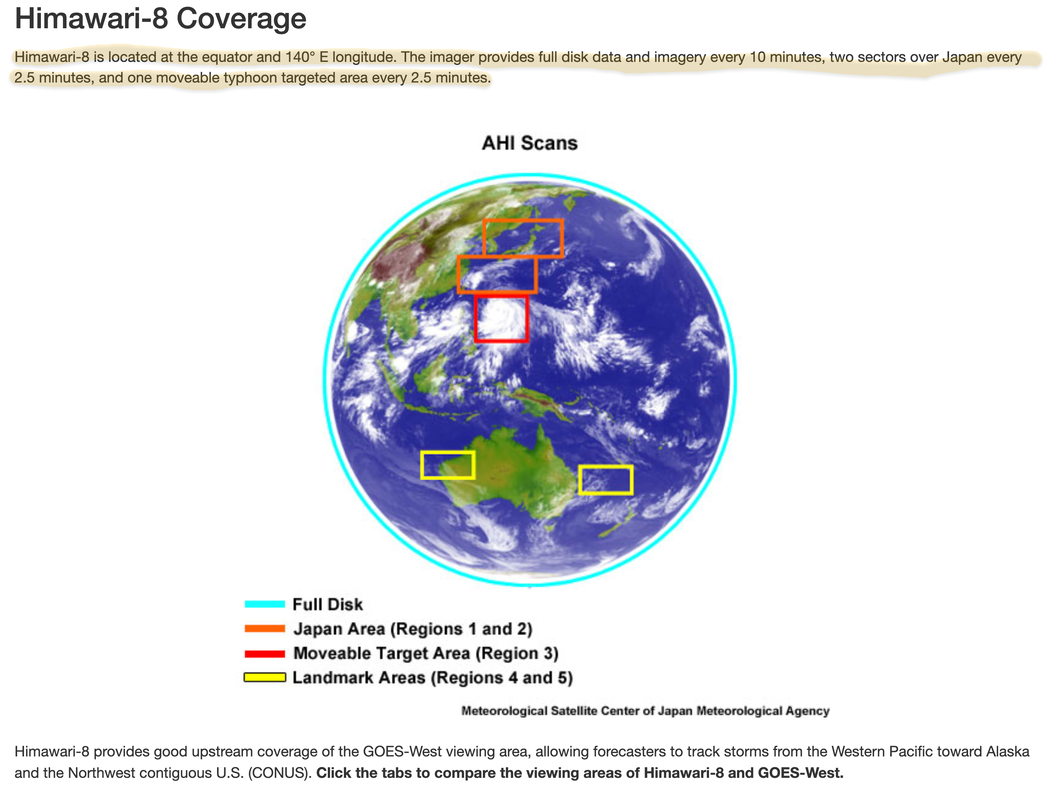
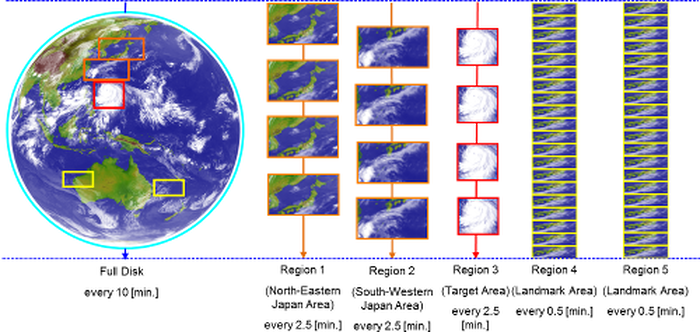
Each 10-minute period incorporates one Full Disk scan, four Japan Area and Target Area scans, and twenty scans for each Landmark Area. This 10-minute sequence is a basic unit of the observation schedule timeline. In Himawari-8 and -9 baseline observations, the timeline is repeated every 10 minutes except during housekeeping operation.
Each 10-minute period incorporates one Full Disk scan, four Japan Area and Target Area scans, and twenty scans for each Landmark Area. This 10-minute sequence is a basic unit of the observation schedule timeline. In Himawari-8 and -9 baseline observations, the timeline is repeated every 10 minutes except during housekeeping operation.
U.S. GOES-16 (15 Minutes)
U.S. satellites are doing the imaging a little different, so it gives the GOES an extra 5 minutes to scan the internal continental U.S. at a higher temporal frequency.
For more detail on cloud motions.
Can also scan 2 storms.
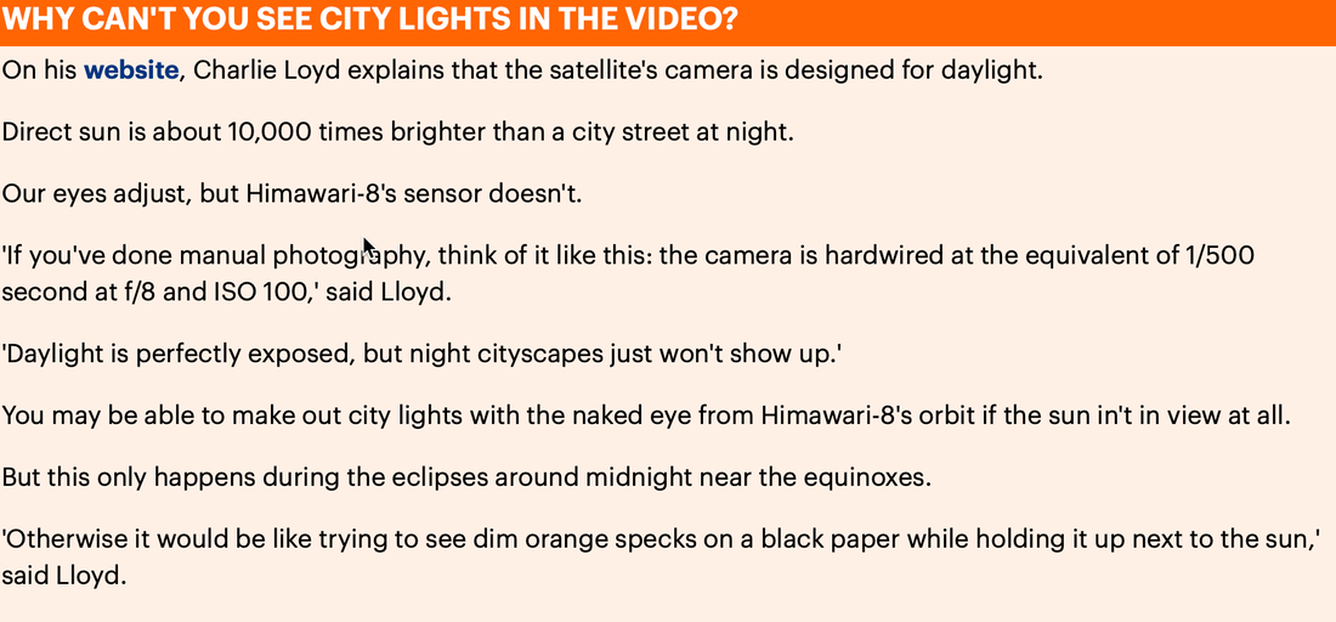
In the daytime you can see the full color globe but at night you can still see the clouds because it is using infrared cameras at night. These are overlaid upon blue marble.
You also see a flicker around midnight where the camera is pointing to the sun
U.S. satellites are doing the imaging a little different, so it gives the GOES an extra 5 minutes to scan the internal continental U.S. at a higher temporal frequency.
For more detail on cloud motions.
Can also scan 2 storms.
In the daytime you can see the full color globe but at night you can still see the clouds because it is using infrared cameras at night. These are overlaid upon blue marble.
You also see a flicker around midnight where the camera is pointing to the sun
Imaging timetable that shows you all the observations that go on in that 15 minute window
And then repeats it after this,
And then repeats it after this,
|

|
|
|
Doppler Radar .... DITRH DEBUNKED AGAIN!
So, the purpose is to detect the wind speed as well as water vapour in the cloud, not imaging of the cloud.
So, the purpose is to detect the wind speed as well as water vapour in the cloud, not imaging of the cloud.
Impossible to use ground based systems to cover the vast oceans?
Weather over oceans software simulations?? Huh?
For weather over the land...The NOAA has supercomputers taking data coming
in from over the land from Doppler radar feeds and coming it with weather simulation
software over the oceans to come up with a complete composite doppler map.
What about weather balloons? NO, they do not cover the whole earth and there is no
way thousands of weather balloons could all communicate to stitch together a full disk images every 10 minutes. Citations PLEASE!!
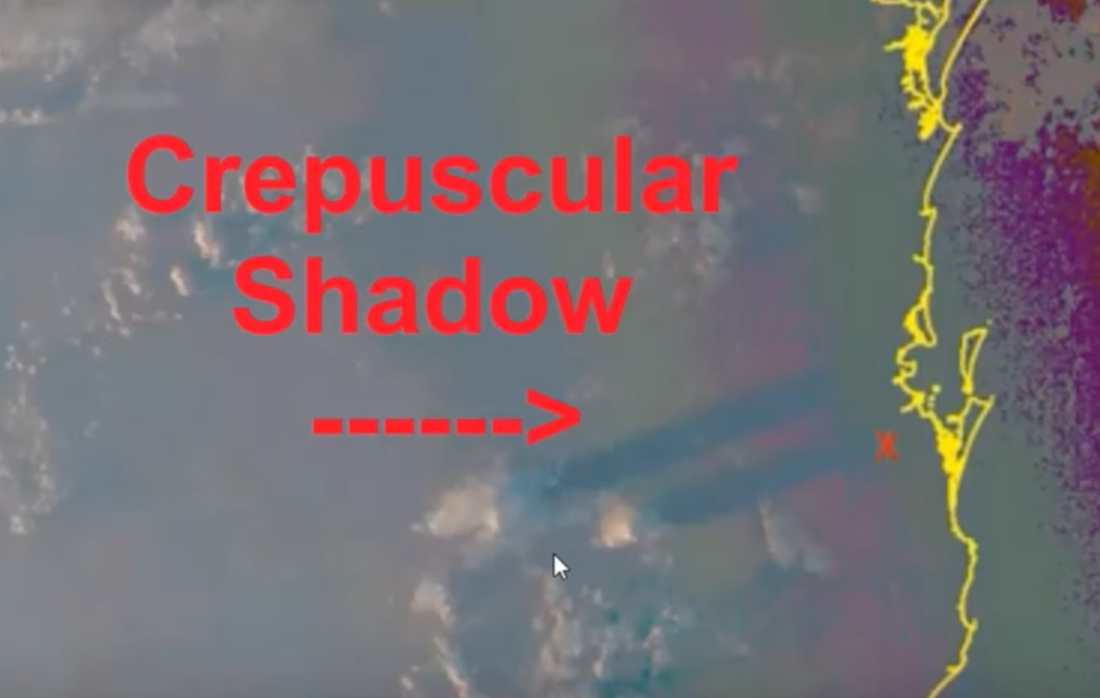
The supposed simulation claim isn't able to account for the things like bush fires and the smoke plumes that are visible both on the Himawari8 and out the window.
The night time clouds are so easy, they use IR images. This is so basic and been done for years.
So the clouds shapes come from the satellite and then go to the computers for modelling and recording for future reference.
On further investigation it seems Himawari satellites use (ABI) to capture and overlay the countries.
Not blue marble data sets.
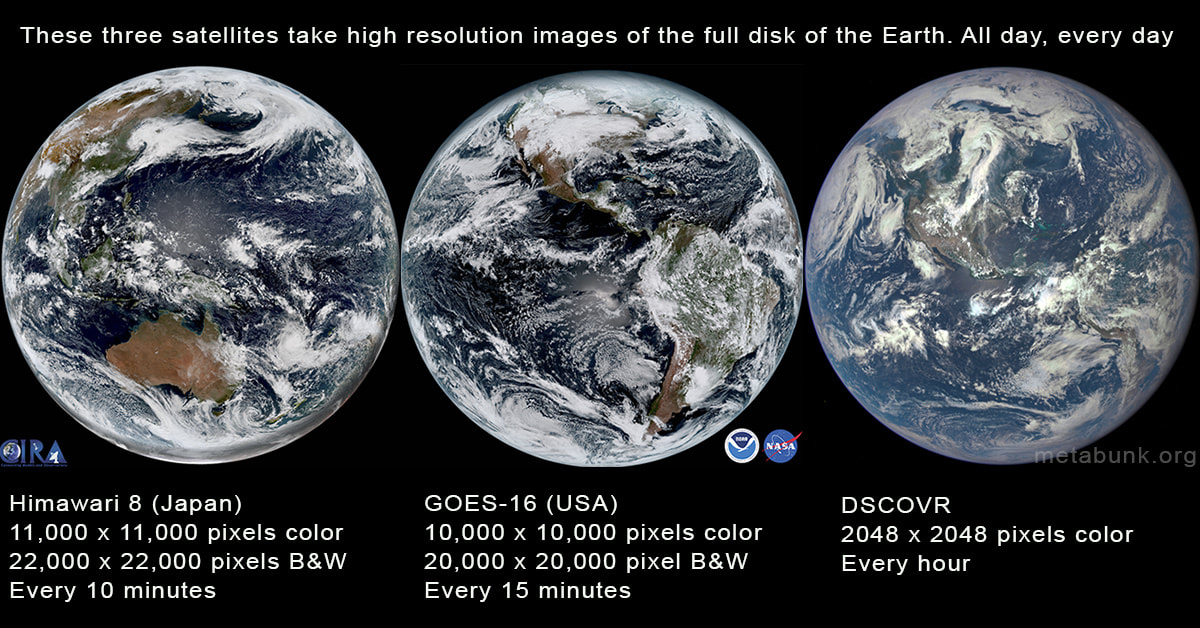
Full Earth Images from Space Taken Daily - HUNDREDS!
There are several satellites that take photos of the full disk of the earth on a regular basis, but the most impressive are the three above. The first two (Himawari-8 and GOES-16) are geostationary satellites taking photos from 22,236 miles above the Earth's equator. The third, DSCOVR is located in an orbit between the Earth and the Sun, about one million miles away. All three take several photos a day
USA: GOES 16 & 17 (RAMMB/CIRA SLIDER) (Zoomable, HD) , NEXLAB, NOAA Full Resolution (17)
Japan: Himawari-8 (JME), RAMDIS Feeds , JME Feed (11K), NICT zoomable archive (best).
USA: DSCOVR (L1) (Full disk rotating Earth from a fixed relative point)
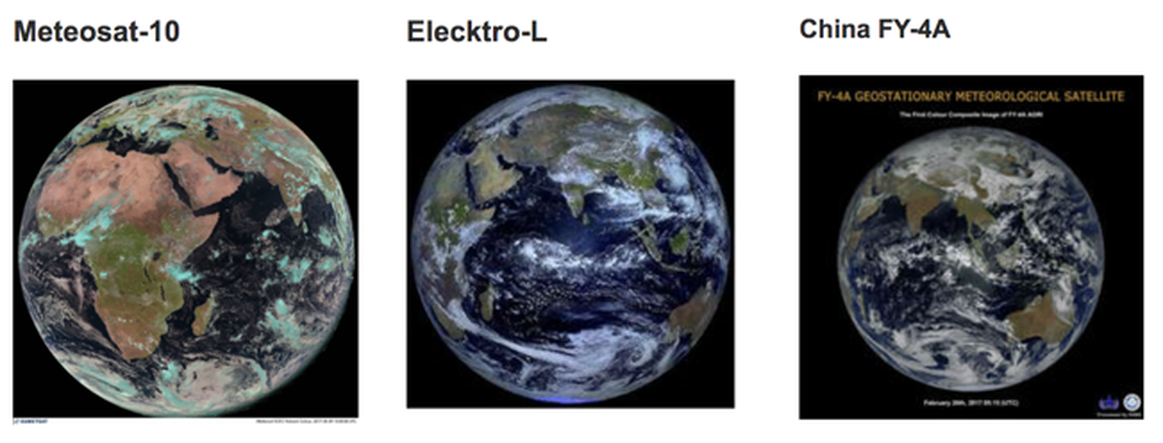
Europe: Meteosat-10 (11K), Historical Viewer (slow)
India: INSAT
Russia: Elektro-L (11K) (Ntsomz interactive view and download) (FTP Archive)
China FY-4A
There are several satellites that take photos of the full disk of the earth on a regular basis, but the most impressive are the three above. The first two (Himawari-8 and GOES-16) are geostationary satellites taking photos from 22,236 miles above the Earth's equator. The third, DSCOVR is located in an orbit between the Earth and the Sun, about one million miles away. All three take several photos a day
USA: GOES 16 & 17 (RAMMB/CIRA SLIDER) (Zoomable, HD) , NEXLAB, NOAA Full Resolution (17)
Japan: Himawari-8 (JME), RAMDIS Feeds , JME Feed (11K), NICT zoomable archive (best).
USA: DSCOVR (L1) (Full disk rotating Earth from a fixed relative point)
Europe: Meteosat-10 (11K), Historical Viewer (slow)
India: INSAT
Russia: Elektro-L (11K) (Ntsomz interactive view and download) (FTP Archive)
China FY-4A
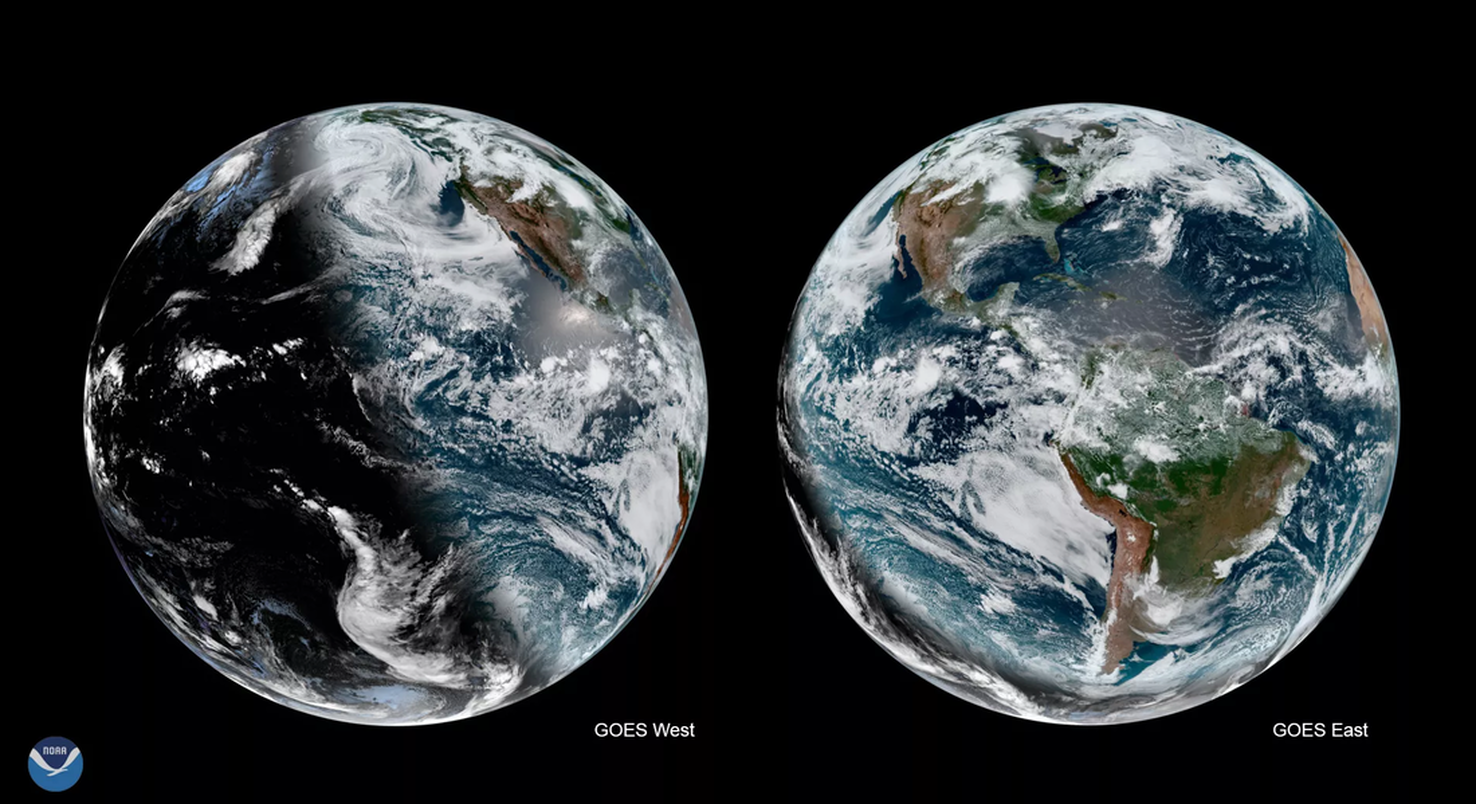
GOES East (GOES-16) and GOES West (GOES-17)
WHOLE EARTH Image of the Earth taken recentlyby GOES-16 satellite
GOES-16 Is basically NASA's version of Himawari-8. Like the Himawari series, the GOES series have all been weather satellites.
Their primary mission is helping forecast the weather, so up until now they have just given black and white images (one visible wavelength, and several infrared wavelengths). GOES satellites have actually been taking full disk images for many years, but GOES-16 is by far the best, with a higher resolution camera, and color. Here's a comparison of GOES-16 and GOES-13 taken at about the same time. Notice the position is different, GOES-16 being further west than GOES-13
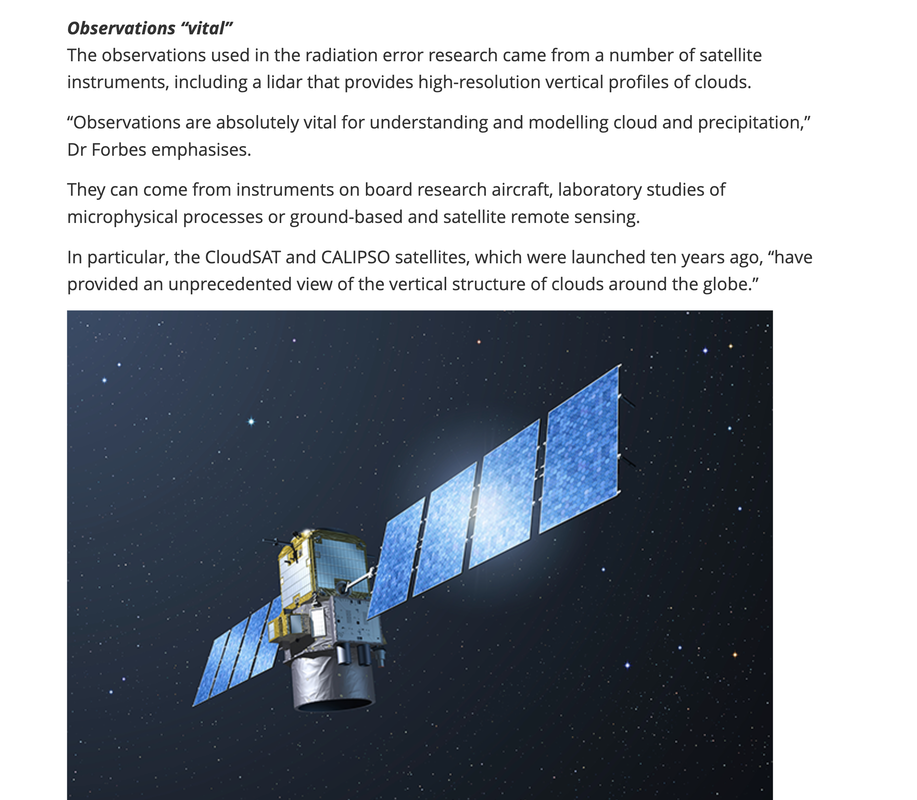
Truth Observations
Ground truth observations will be a dagger in the flat earth!
The idea that all this data is faked and yet matches actual weather patterns is just ridiculous.
The idea that all this data is faked and yet matches actual weather patterns is just ridiculous. The idea that somehow ground doppler radar can produce 11K images is Ludicrous. That is NOT how doppler works!!
The idea that all of these are simple photoshop images or even the idea that there are millions of planes and balloons scouring the Earth every minute of the day and night so we get accurate image data we can render into globes is just absurd.
Or I have heard some flat earthers say it is doppler radar at ground level recreating them. CLEARLY THEY DON'T UNDERSTAND DOPPLER RADAR!
Lunar Eclipses
Dust Clouds
Volcanos
Aurora Borealis
Bush Fires china and australia
Floods / Track Flood Water
Look at some of the brief video clips below of lunar eclipse shadows right on schedule, fires in Australia and China that were caught on Himawari and saved lives (doppler cannot get this), just clouds, volcanos, floods and Aurora Borealis, all things GROUND DOPPLER CANNOT CAPTURE.
The Himawari-8 is a flat earth KILLER (as is GOES 16/17, DISCVR, ELECKTRO-L, METEOSAT and others).
Ground Truth Confirmation
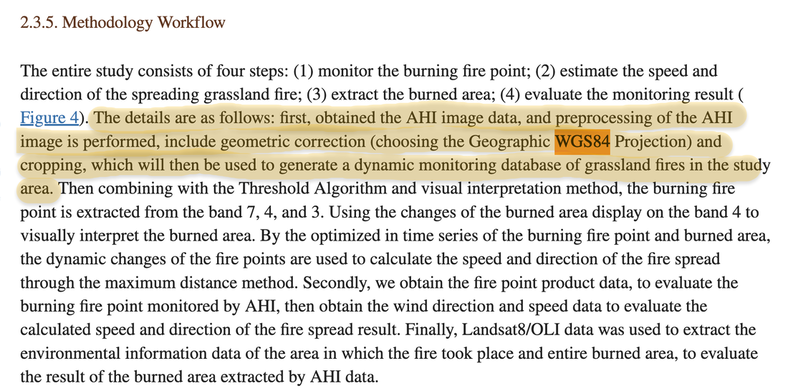
Himawari-8 Satellite Based Dynamic Monitoring of Grassland Fire in China-Mongolia Border Regions
https://www.ncbi.nlm.nih.gov/pmc/articles/PMC5795838/
2015 wildfire on China Mongolia border
From the Himawari 8 they were able to track and predict the
Path of the wildfire and save lives.
Himawari-8 Satellite Based Dynamic Monitoring of Grassland Fire in China-Mongolia Border Regions
https://www.ncbi.nlm.nih.gov/pmc/articles/PMC5795838/
2015 wildfire on China Mongolia border
From the Himawari 8 they were able to track and predict the
Path of the wildfire and save lives.
This sequence shows wildfires from Northern California from 2017 from GOES-16
Tracking Hurricanes
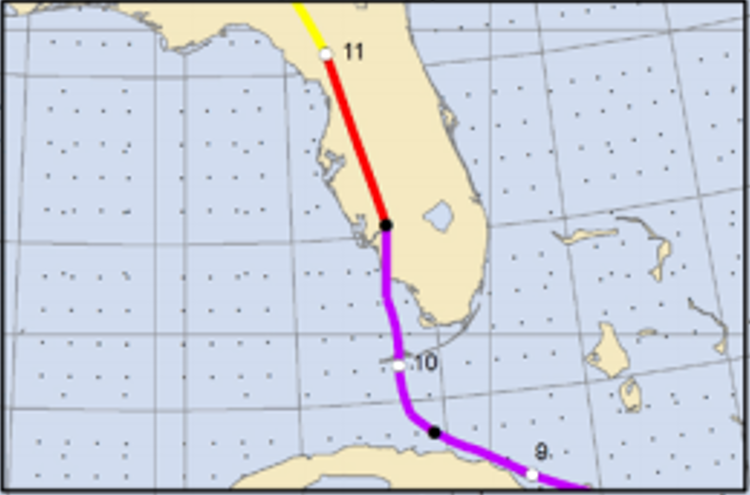
Hurricanes - Living in Florida for 15 years I have been involved with two Major Hurricanes, Hurricane Irma and Hurricane Ian. Being in a flood zone, I fled Florida from Hurricane Irma but I witnessed its devastation when I got back. Very recently I actually endured Hurricane Ian close to my house but in a well protected structure that was not in a flood zone. I watched hurricane Ian from GOES-16 very regularly and was amazing at the size and power of the storm, and amazed also at how high resolution these GOES-16 images were.
Hurricane Irma on Left, Hurricane Ian on Right as it makes landfall and devastates Ft Myers and surrounding area. I was kinda lucky to be JUST BARELY north enough not to get devastating winds, but still A LOT of damage!
Solar Eclipse from Himawari

University of Wisconsin Madison put together this video of an eclipse passing over the continental U.S. (Below).
RAIKOKE VOLCANIC Eruption seen from Space 🌋 Himawari 8 & the ISS
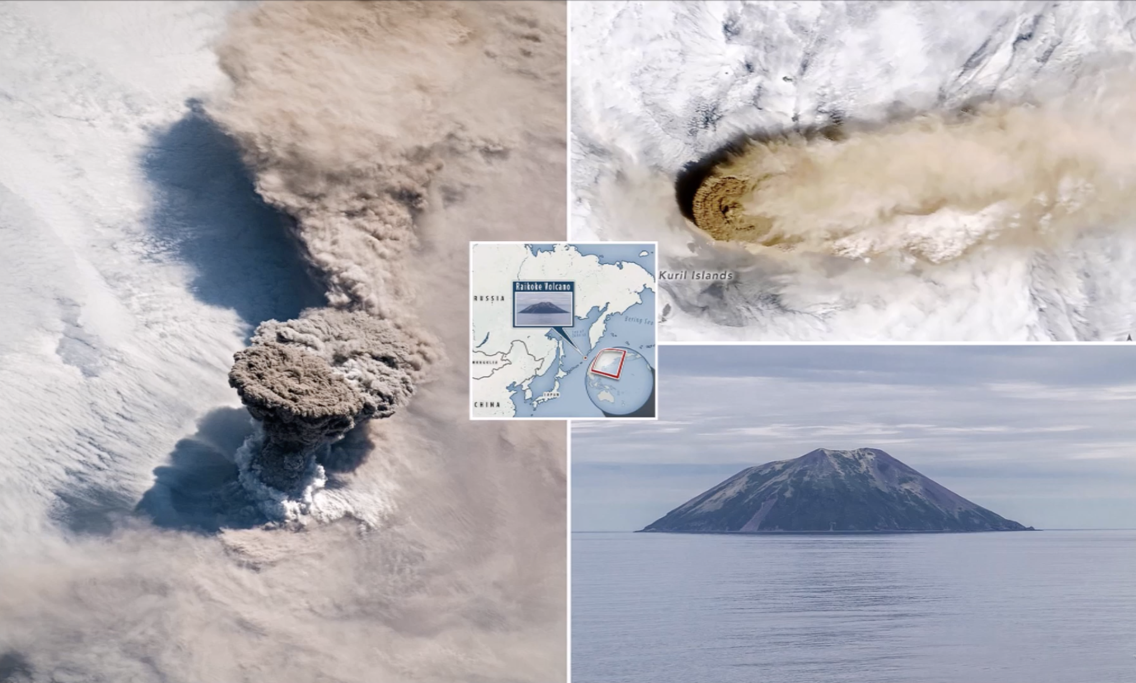

Eruption of Mt Sinabung in Indonesia from Himawara 8
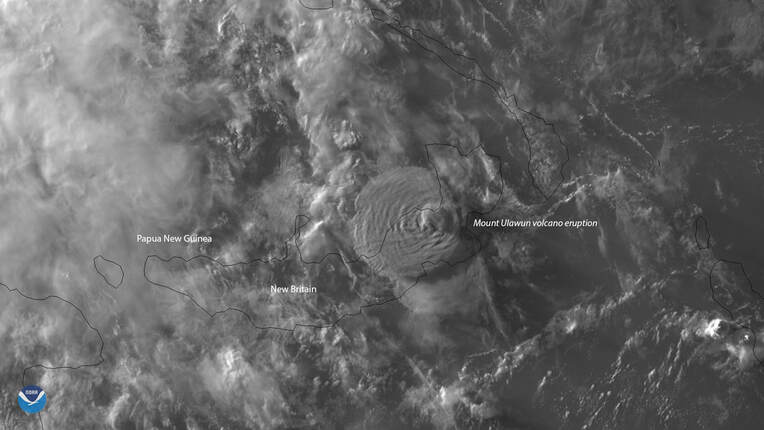
Himawari-8 Sees Volcanic Cloud from Mt. Ulawun Eruption
About 5,000 people in June 2019 were forced to flee their homes Wednesday, June 26, 2019, when Mount Ulawun on the island of New Britain in Papua New Guinea erupted. Himawari-8 saw this volcanic cloud, which reached a maximum height of 22 kilometers or more than 13 miles,
About 5,000 people in June 2019 were forced to flee their homes Wednesday, June 26, 2019, when Mount Ulawun on the island of New Britain in Papua New Guinea erupted. Himawari-8 saw this volcanic cloud, which reached a maximum height of 22 kilometers or more than 13 miles,
Annular Solar Eclipse “Ring of Fire” seen from space | Himawari 8

FLAT EARTH debunked by HIMAWARI 8 ground observationsAn observation Wade's Underground did matching his local weather with images from Himawari 8.
The popular flat earth argument that satellites images are cgi or fake or doppler is completely debunked by this observation. Matching satellite images with ground based observations.
The popular flat earth argument that satellites images are cgi or fake or doppler is completely debunked by this observation. Matching satellite images with ground based observations.